


 668 / 762

668
Chapter 15: Chi-Square Tests
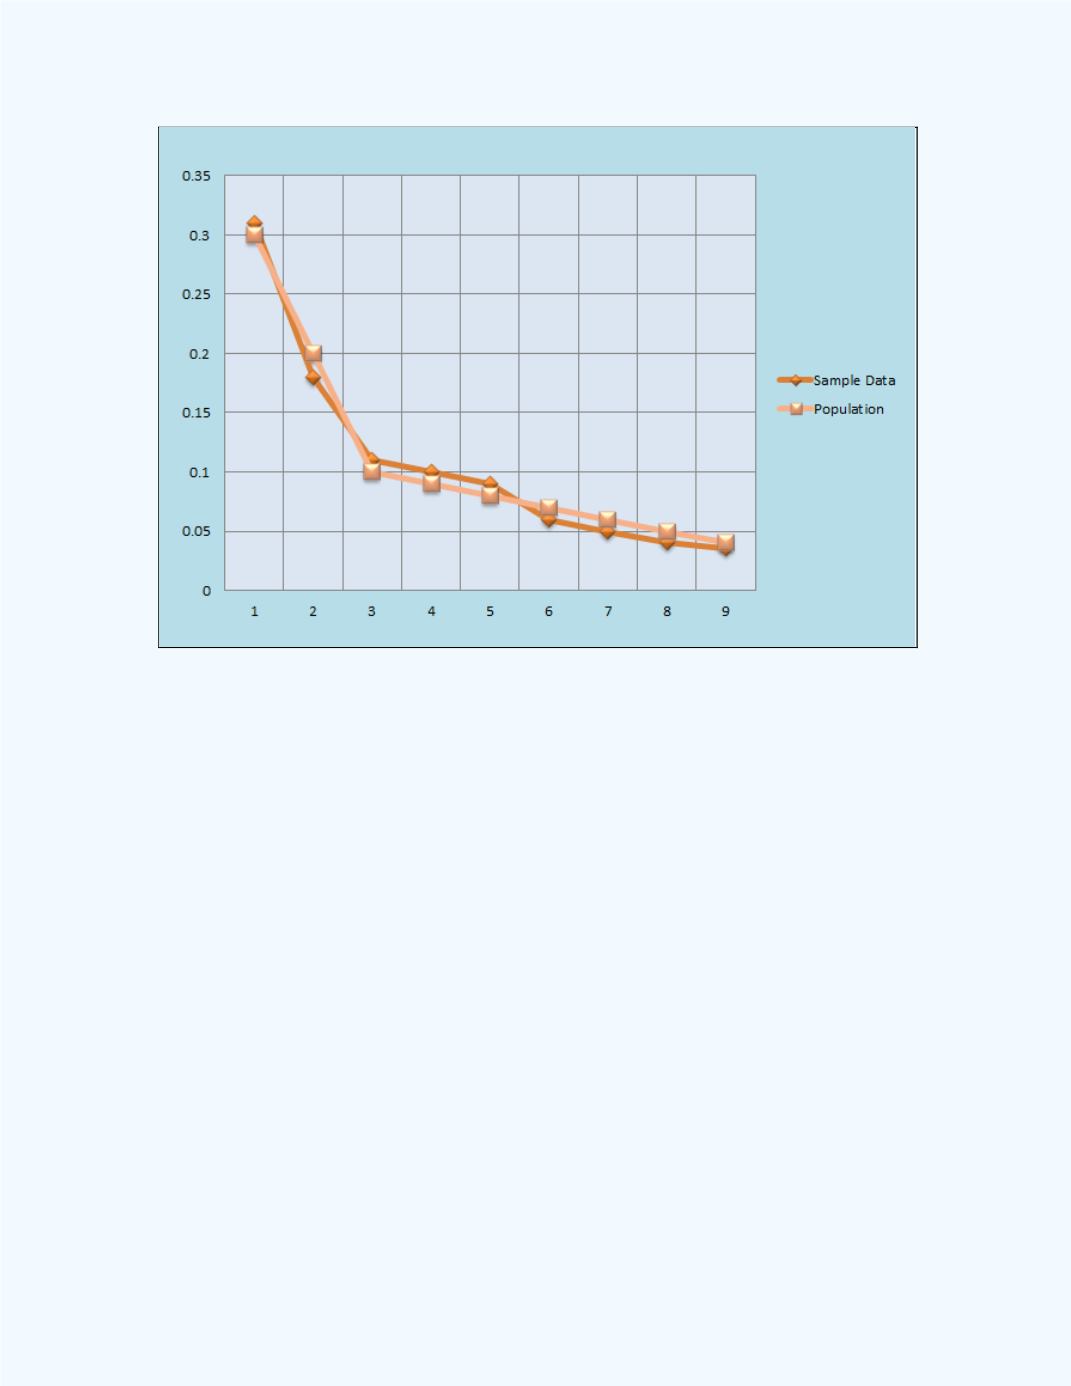
Figure 15-8:
Display of Sample Distribution closely
following the Population Distribution
Generally, we can assume that a good fit exists between the sample data and
the population distribution. That is, we can propose a hypothesis that a
specified theoretical distribution is appropriate to model the sample data or
pattern. This, of course, will be your null hypothesis. Since this sample is
one of the many possible samples, we can investigate the chance of
obtaining this sample with the differences when we assume that the null
hypothesis is true. If the chance is small, we can reject the null hypothesis
and claim that the fit is not appropriate.
How should one go about deciding the significance of the observed
differences between the sample information and the theoretical or assumed
distribution? To do this, we use a statistic composed of the weighted
differences of the frequencies. This statistic has a chi-square distribution
with
- 1 degrees of freedom, where
is the number of (frequency)
categories, and is given by