


 672 / 762

672
Chapter 15: Chi-Square Tests
Table15-2:
Table with Observed and
Expected Number of sixes for
Example 15-3
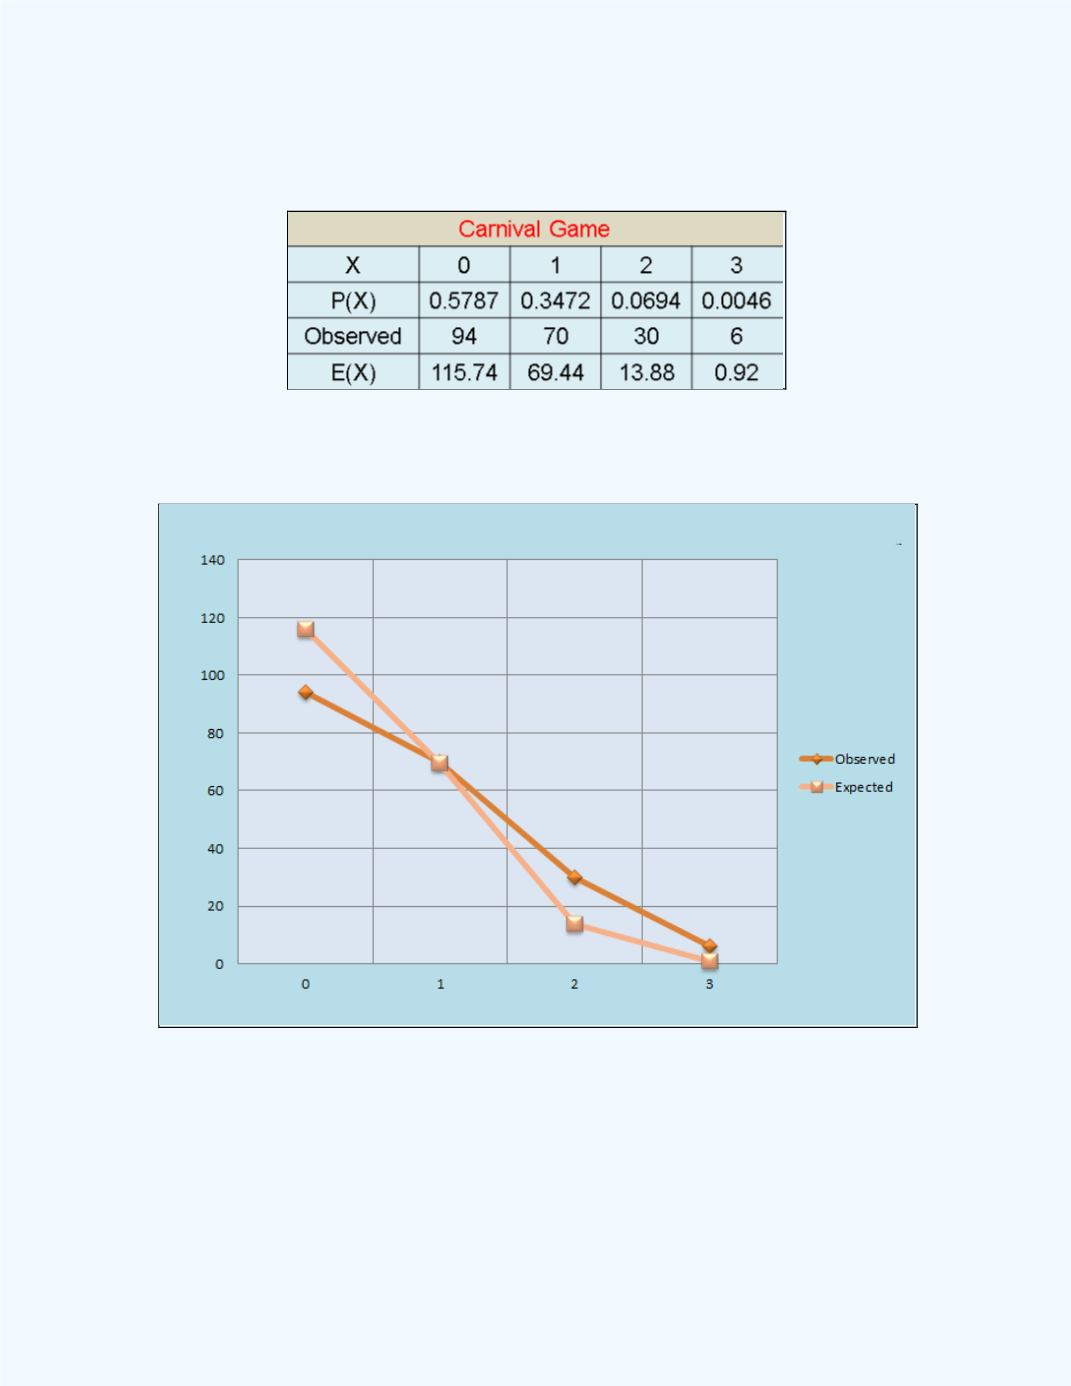
Figure 15-10
provides a visual comparison of the expected and observed
number of sixes observed in the experiment.
Figure 15-10:
Display of the Observed and Expected
Number of Sixes Rolled
From
Figure 15-10
, it is difficult to distinguish whether the differences
between the observed and expected counts are significant. One would have
to do further analysis such as a test of hypothesis for goodness-of-fit to
determine whether the deviations are significant or not.