


 676 / 762

676
Chapter 15: Chi-Square Tests
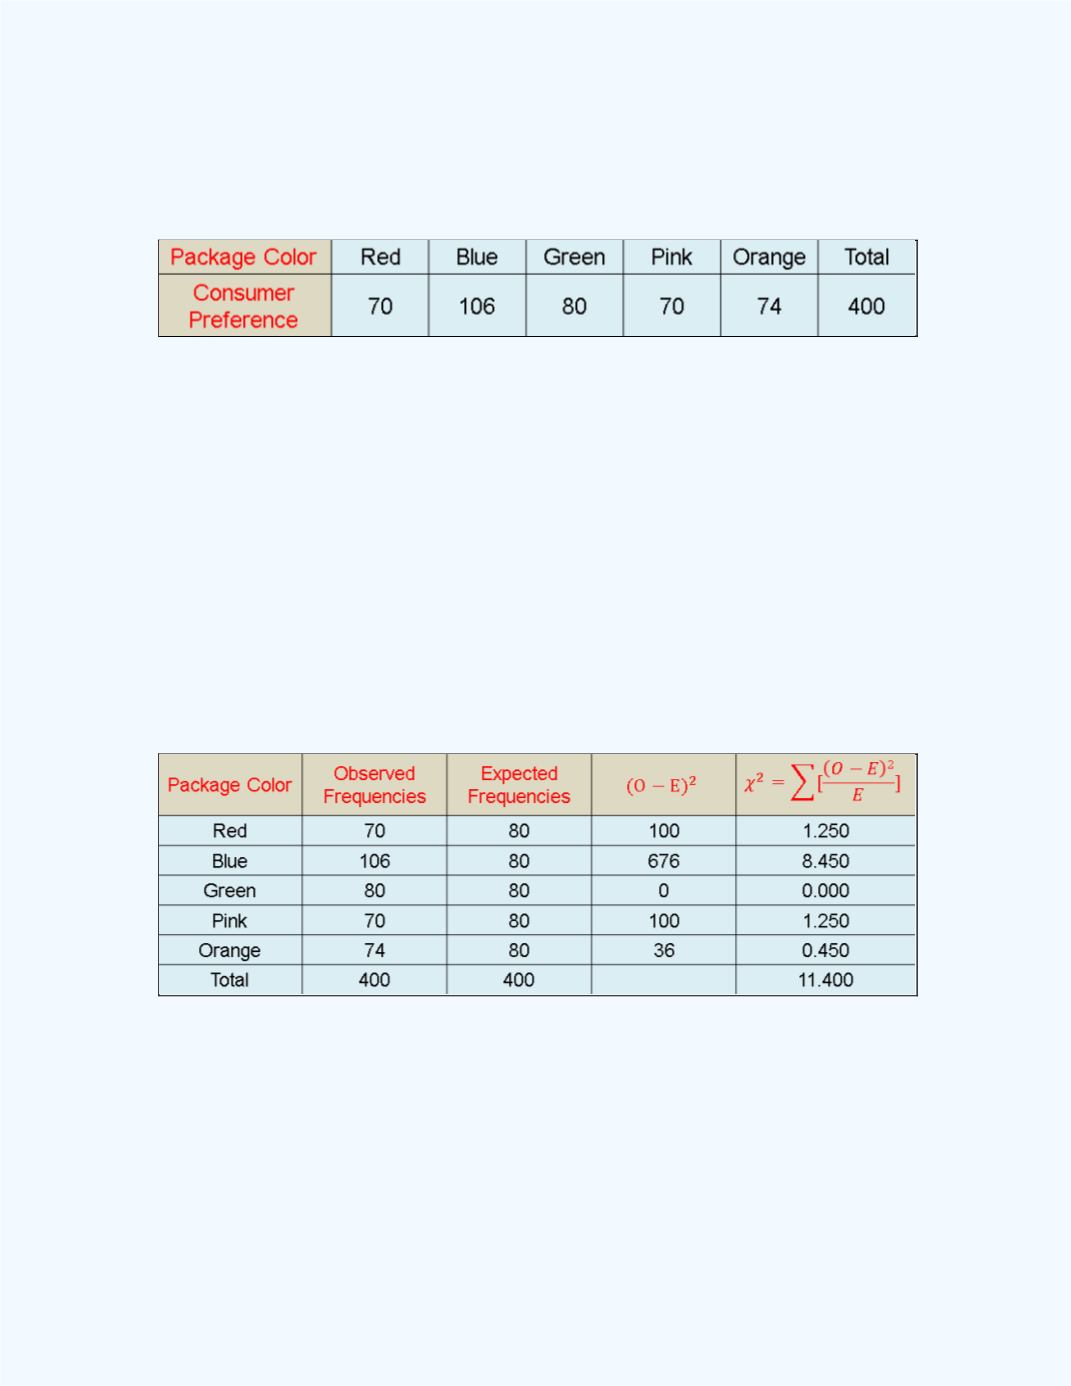
Table 15-3:
Table with summary data for
Example 15-4
Suppose that the marketing manager wishes to test at the 5% significance
level whether or not consumers have a preferred color for packaging.
Solution:
It certainly appears that they preferred the blue packaging.
However, you have to find out whether this preference could have arisen due
to chance or there is a statistically significant difference. The appropriate test
statistic is the
test of goodness-of-fit.
Note that the expected frequencies are all 80 (1/5 of 400 each) under the
assumption that there is no particular color preference.
Table 15-4
shows
some of the information needed to perform the test.
Table 15-4:
Table with computations for
Example 15-4
Using the
Chi-Square Goodness-of-Fit Test
workbook, we can obtain the
test statistic value to help us perform the test. This output is shown in
Figure 15-14
.