


 680 / 762

680
Chapter 15: Chi-Square Tests
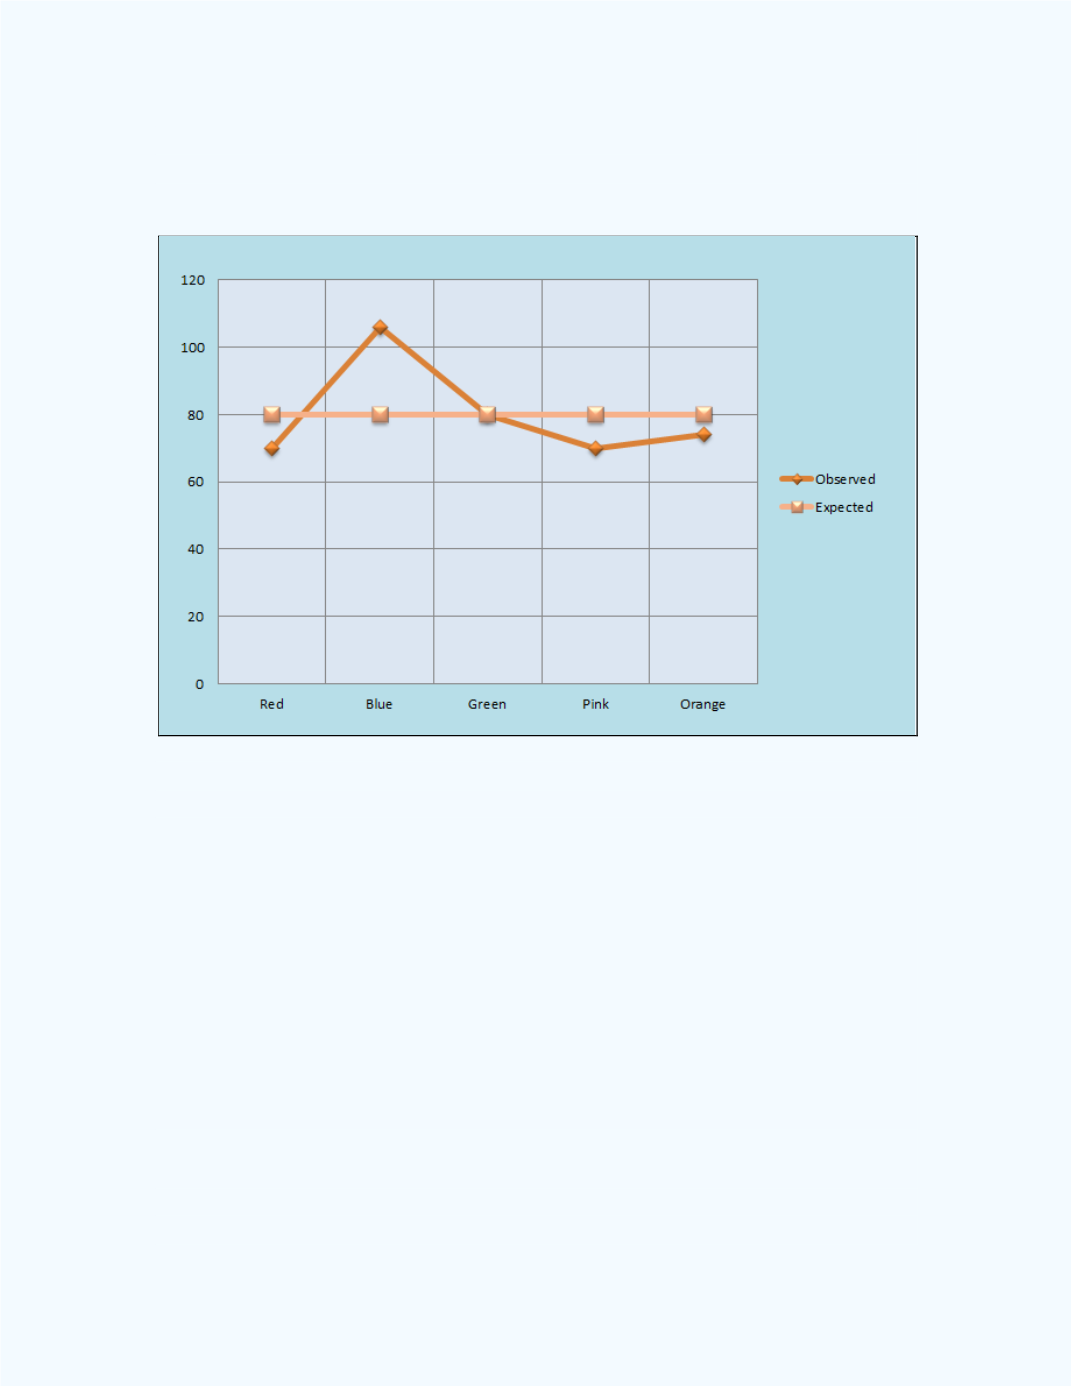
Another perspective of the observed and expected frequencies is shown in
Figure 15-18
. Note that there is not a good fit between the observed and
expected frequencies.
Figure 15-18:
Line Chart with the Observed and
Expected Values for
Example 15-4
Example 15-5:
A tracking was done on four reality TV shows (A, B, C,
and D) during a season. The research indicated that the percentages of the
viewing audience captured by these shows during the first season were 25
percent, 30 percent, 25 percent, and 20 percent, respectively. During the
second season for these shows, a random sample of 300 viewers was
surveyed.
(a) If the viewing pattern has not changed, what number of TV viewers is
expected to watch each reality show during the second season?
Solution (a):
Based on the information, the expected values will be:
0.25
300 = 75, 0.30
300 = 90, 0.25
300 = 75, and 0.20
300 = 60. These
expected values are shown
Table 15-5.