


 681 / 762

Chapter 15: Chi-Square Tests
681
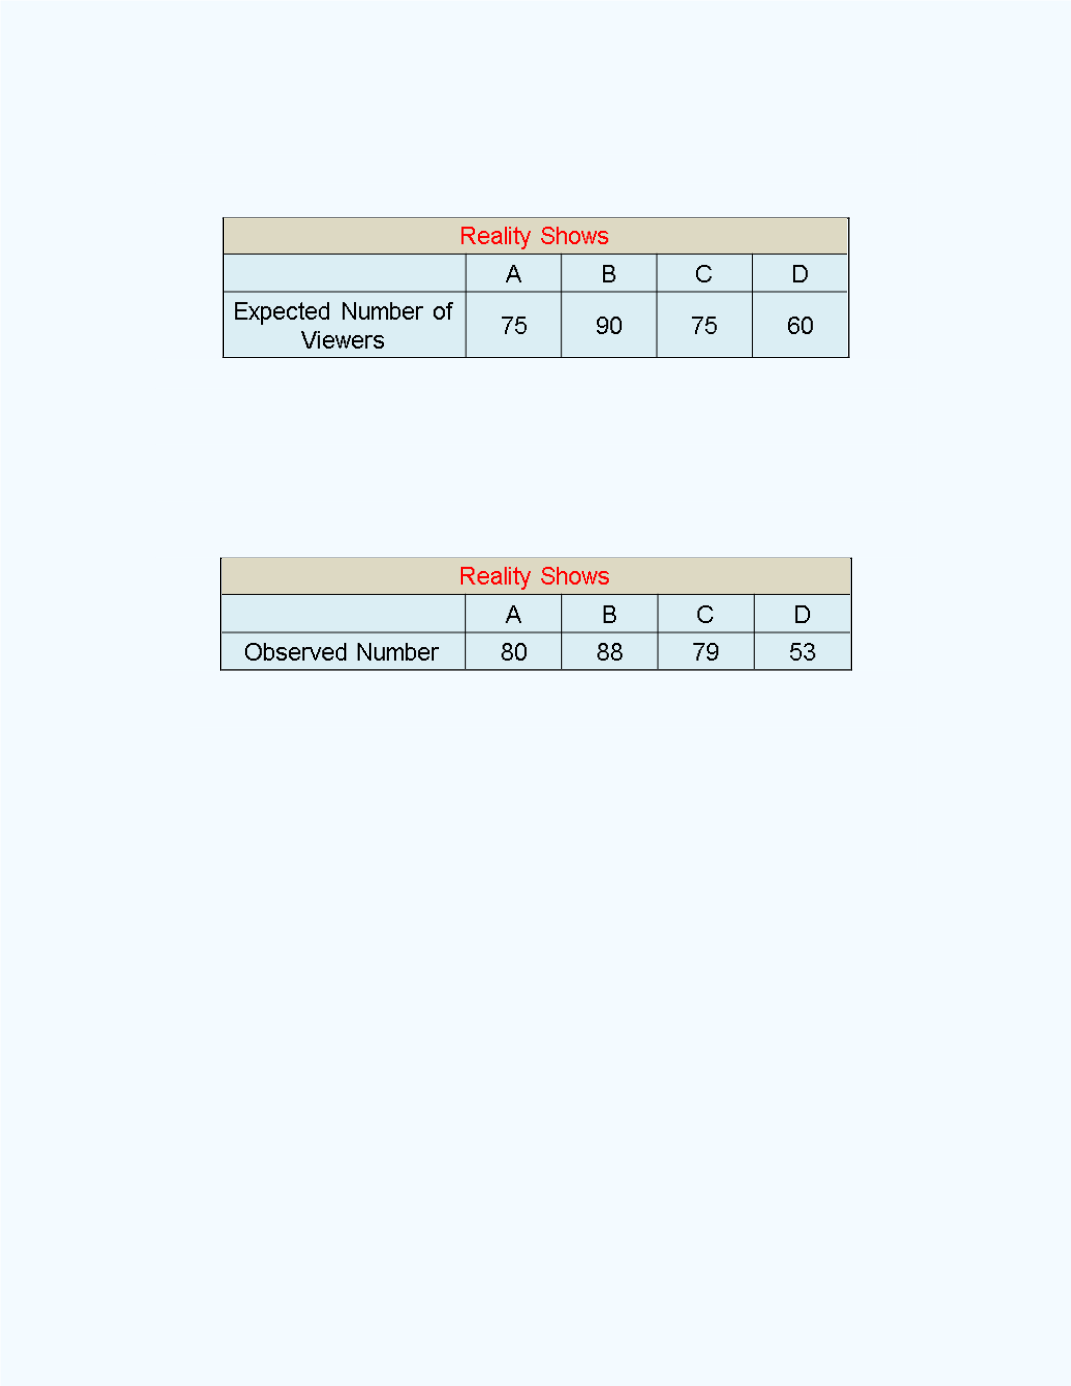
Table 15-5:
Expected frequencies for
Example15-4
(a)
(b) The actual observed numbers in the sample viewing the reality shows are
given in
Table 15-6
.
Table 15-6:
Observed frequencies for
Example 15-4
(b)
Present a bar graph and a line graph for the observed and expected
frequencies. Discuss any observations
.
Solution (b):
Figure 15-19
provides a bar graph to help us to visually
compare the expected and observed number of viewers in the sample for
the different reality TV shows