


 679 / 762

Chapter 15: Chi-Square Tests
679
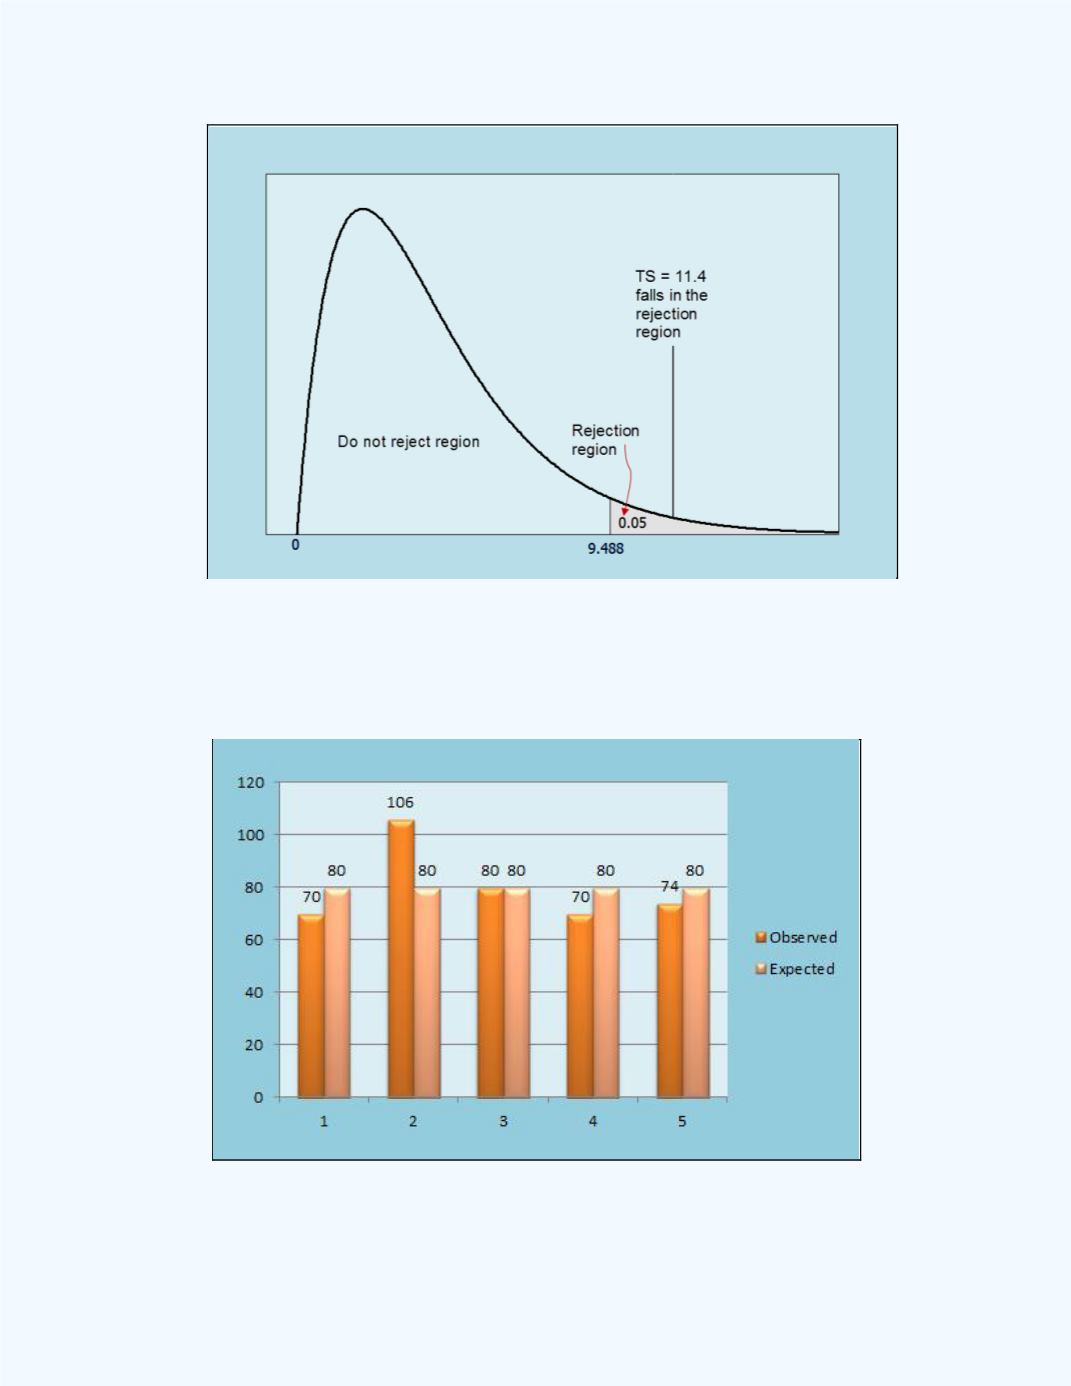
Figure 15-16:
Shaded Critical Region for
Example 15-4
Figure 15-17
shows the bar graph for the observed and expected frequencies
for the problem. Note some differences between them.
Figure 15-17:
Bar Chart with the Observed and
Expected Values for
Example 15-4