


 683 / 762

Chapter 15: Chi-Square Tests
683
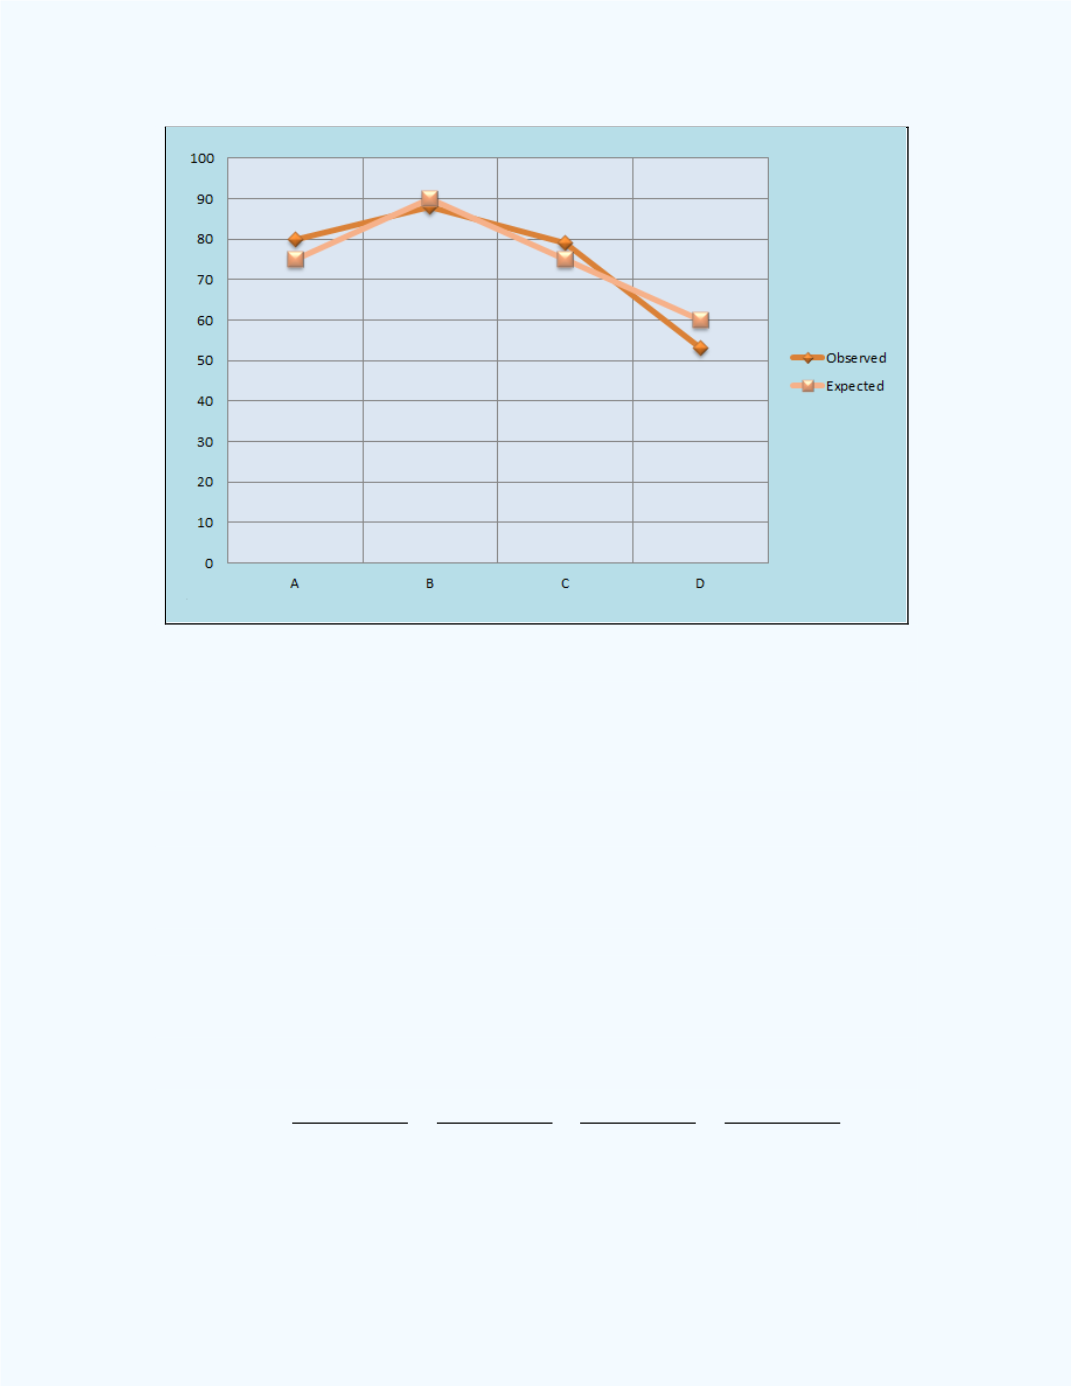
Figure 15-20:
Line Graph of the Observed and Expected
Number of Viewers
From
Figure 15-20
, onemay observe also that that there are differences
between the observed and expected frequencies but it is difficult to
determine, by just viewing the graph, whether there is a significant
difference between the observed and expected frequencies. To confirm this,
one may have to do further analysis such as a test of hypothesis for
goodness-of-fit to determine whether the deviations are significant or not.
(c)
Test at the 1% significance level whether the percentages of the viewing
audience captured by these shows during the first season did not change
significantly during the second season.
Based on the computations so far, the chi-square test statistic will be
( )
( )
( )
( )
= 1.408.