


 687 / 762

Chapter 15: Chi-Square Tests
687
way the expected values are calculated. The stated hypotheses will also be
different.
The chi-square independence test can be used to test for the independence
between two categorical variables.
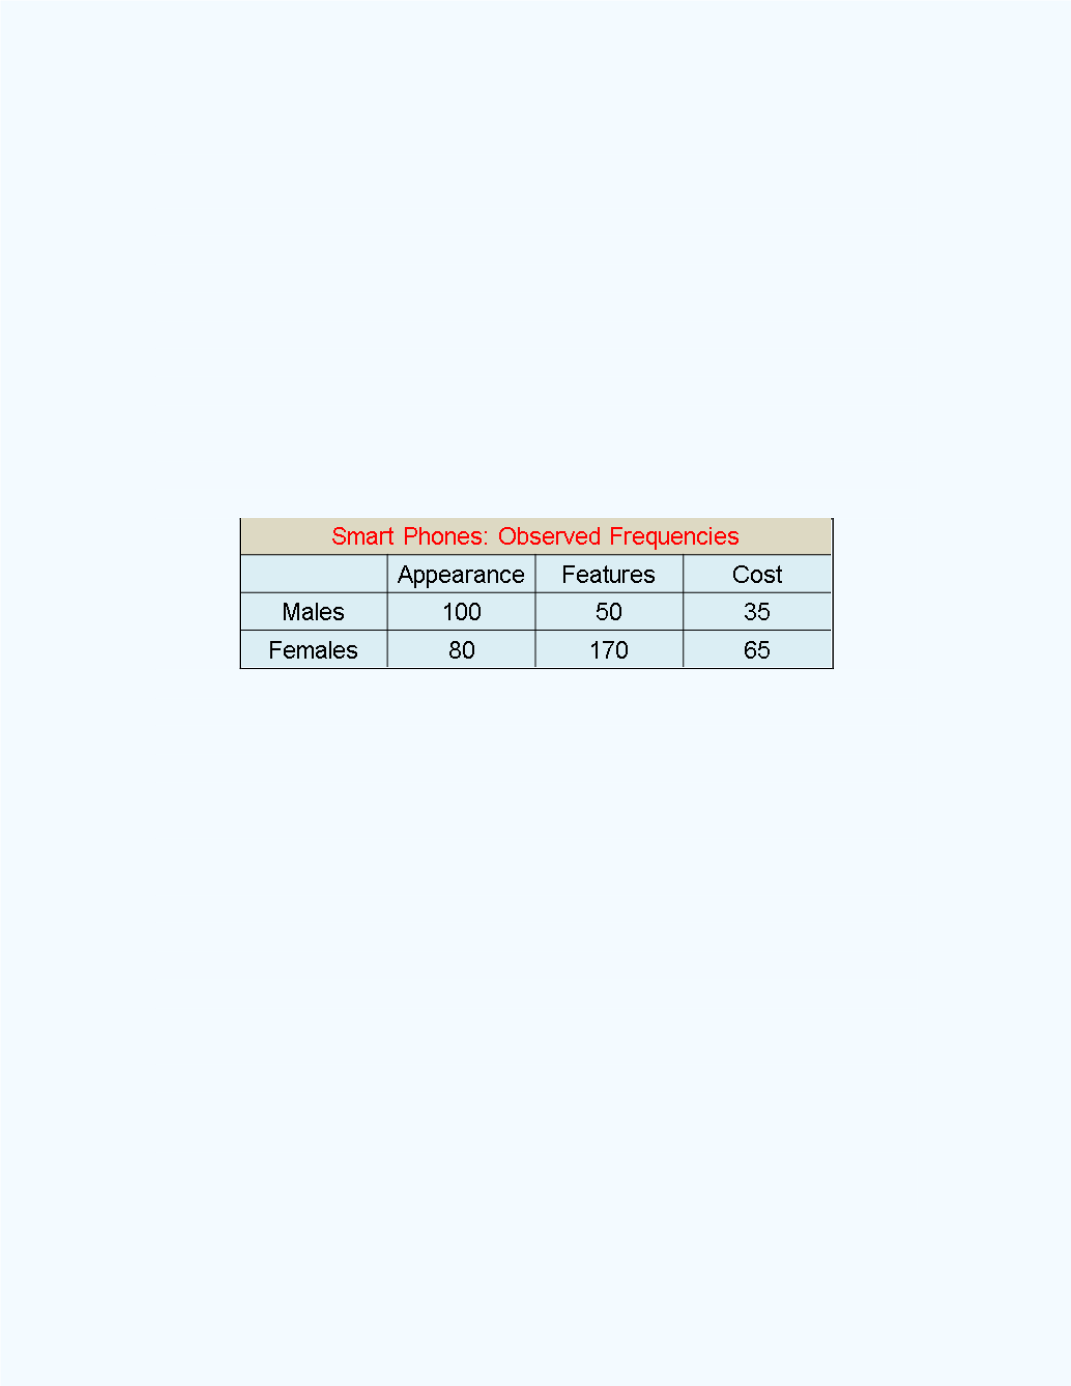
Example 15-6:
A survey was done by a cell phone manufacturer
concerning a particular smart phone model. A group of 500 customers were
asked whether they purchased this particular smart phone because of its
appearance, its features, or its cost. The results, broken down by gender
responses, are given in
Table 15-7.
Table 15-7:
Summary Data for
Example15-6
Question:
Do females feel differently from males, about the three different
criteria used in purchasing this smart phone, or do they feel basically the
same?
One way of answering this question is to determine whether the criterion
used in buying this smart phone is independent of gender. That is, we can
do a test for independence. Thus the null hypothesis will be that the
criterion used is independent of gender, while the alternative hypothesis will
be that the criterion used is dependent on gender.
When data are arranged in tabular form for the chi-square independence test,
the table is called a
contingency table
. Here
Table 15-7
has 2 rows and 3
columns of data (excluding the marginal totals), so we say we have a 2 by 3
(2
3) contingency table. The number of degrees of freedom for any
contingency table is given by
(number of rows – 1)
(number of columns –
1)
. In this example,
df
= (2 – 1)
(3 – 1) = 2.