


 682 / 762

682
Chapter 15: Chi-Square Tests
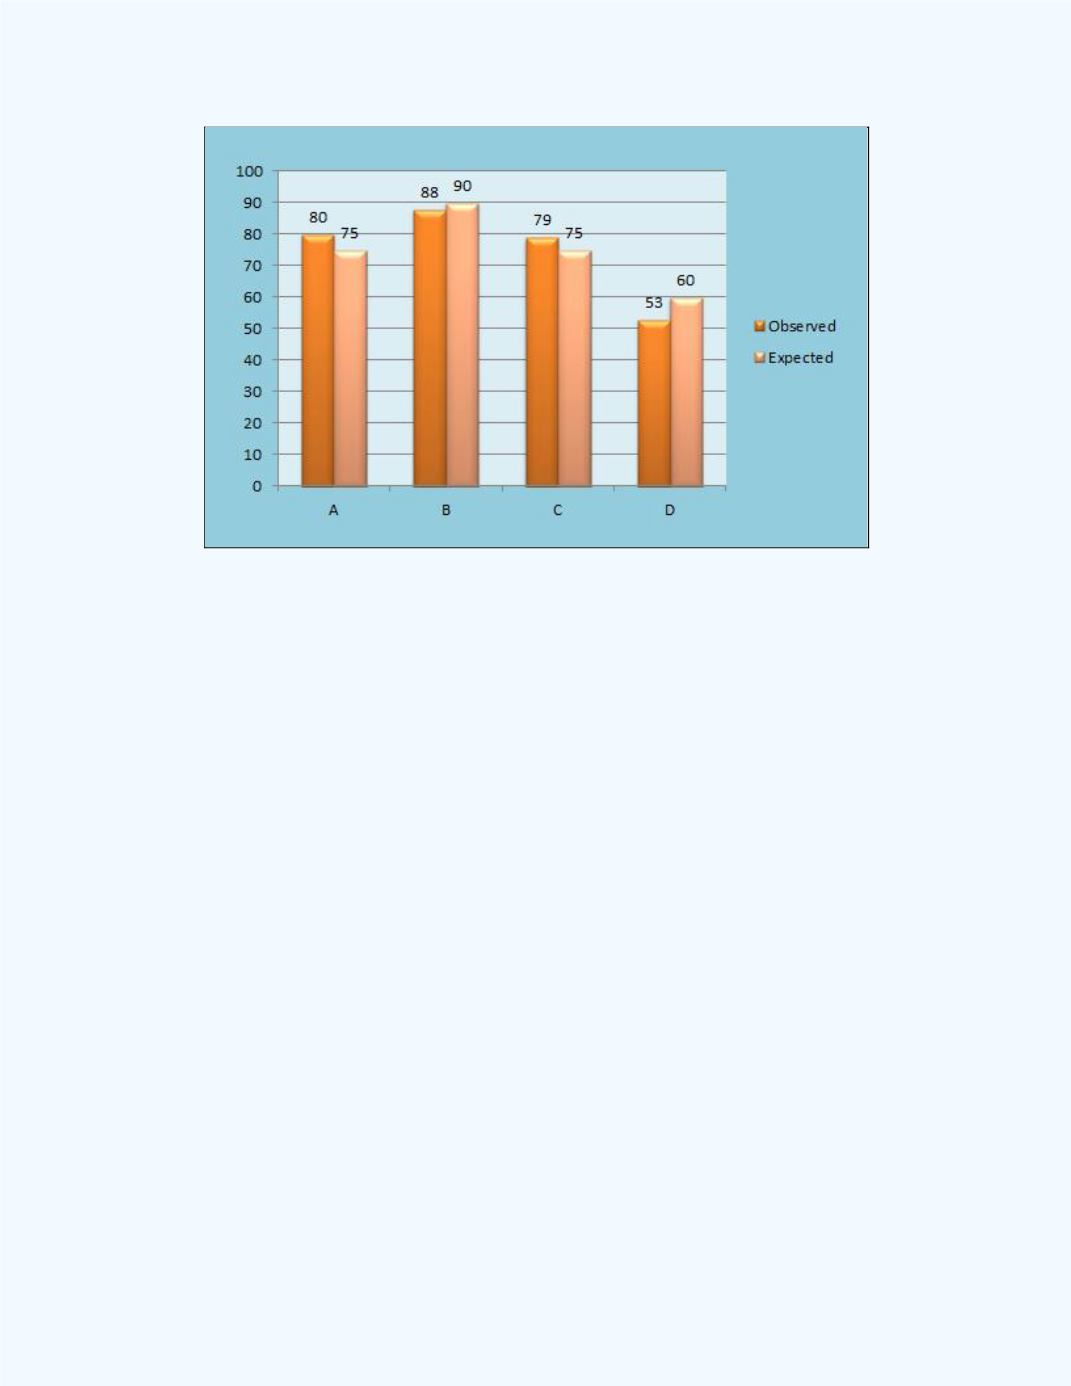
Figure 15-19:
Bar Graph of the Observed and Expected
Number of Viewers
From
Figure 15-19
one can observe that there are differences between the
observed and expected frequencies. However, it is difficult to determine
whether these differences are significant.
Figure 15-20
provides a line graph to help us to visually compare the
expected and observed number of viewers in the sample for the different
reality TV shows