


 665 / 762

Chapter 15: Chi-Square Tests
665
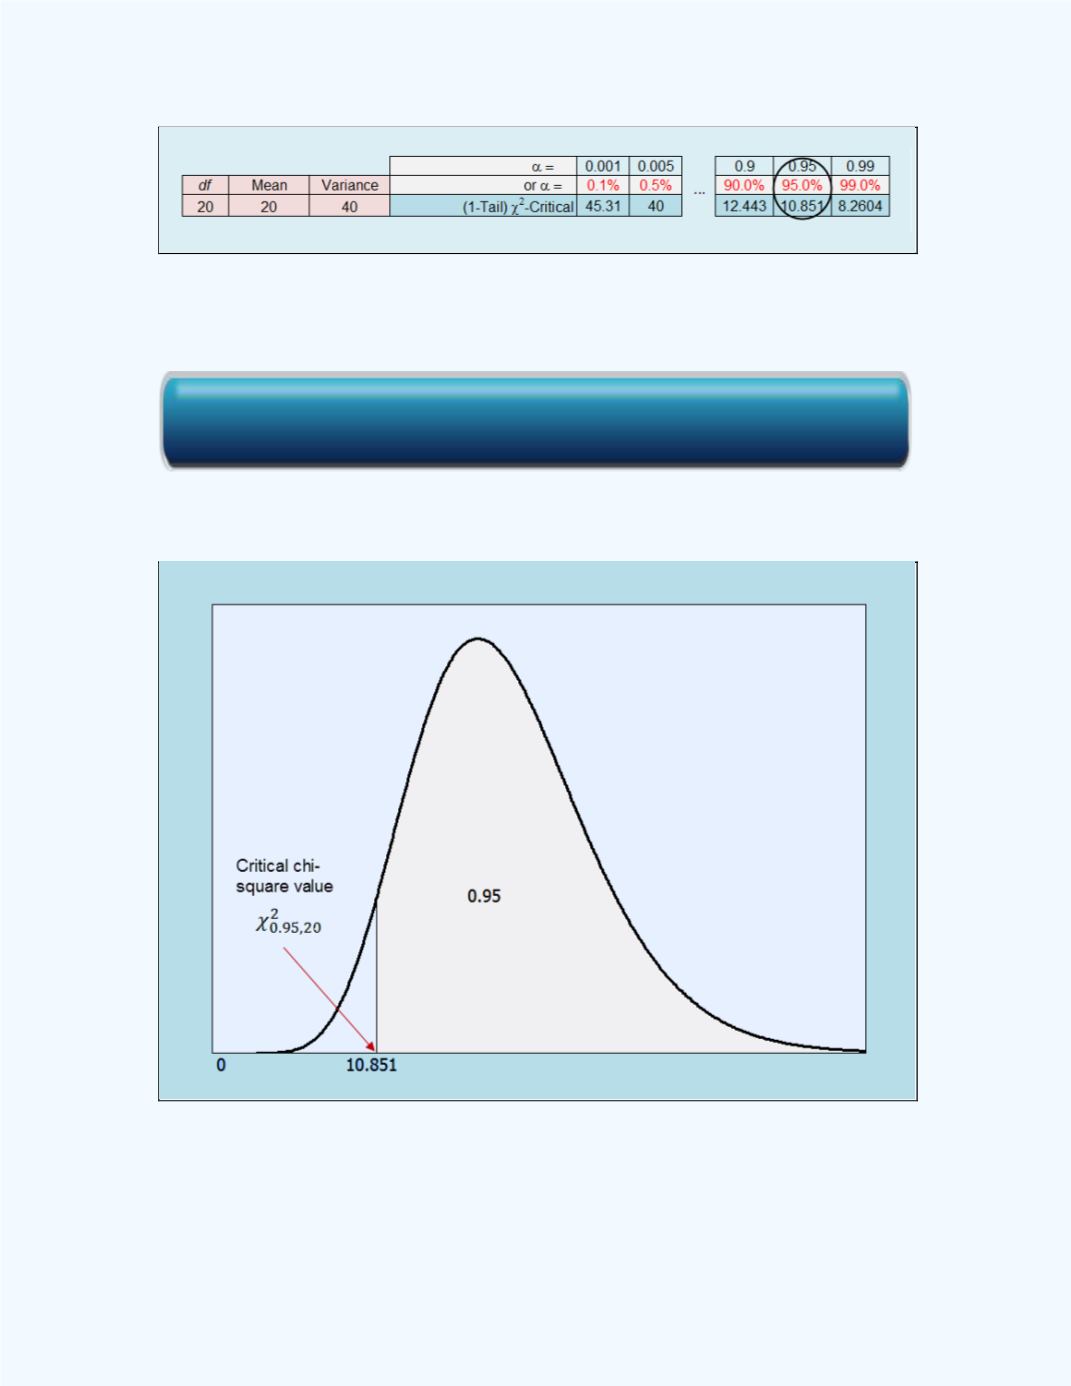
Figure 15-5:
Critical Values for the Chi-Square
Workbook value for
The shaded critical area is shown in
Figure 15-6
.
Figure 15-6:
Shaded Area for
Next we will discuss how we can use the chi-square distribution to test the
goodness-of-fit of a set of observed data to an established distribution.
Click here for the Critical Values for the Chi-Square Distribution Workbook