


 131 / 762

Chapter 3: Measures of Variability
131
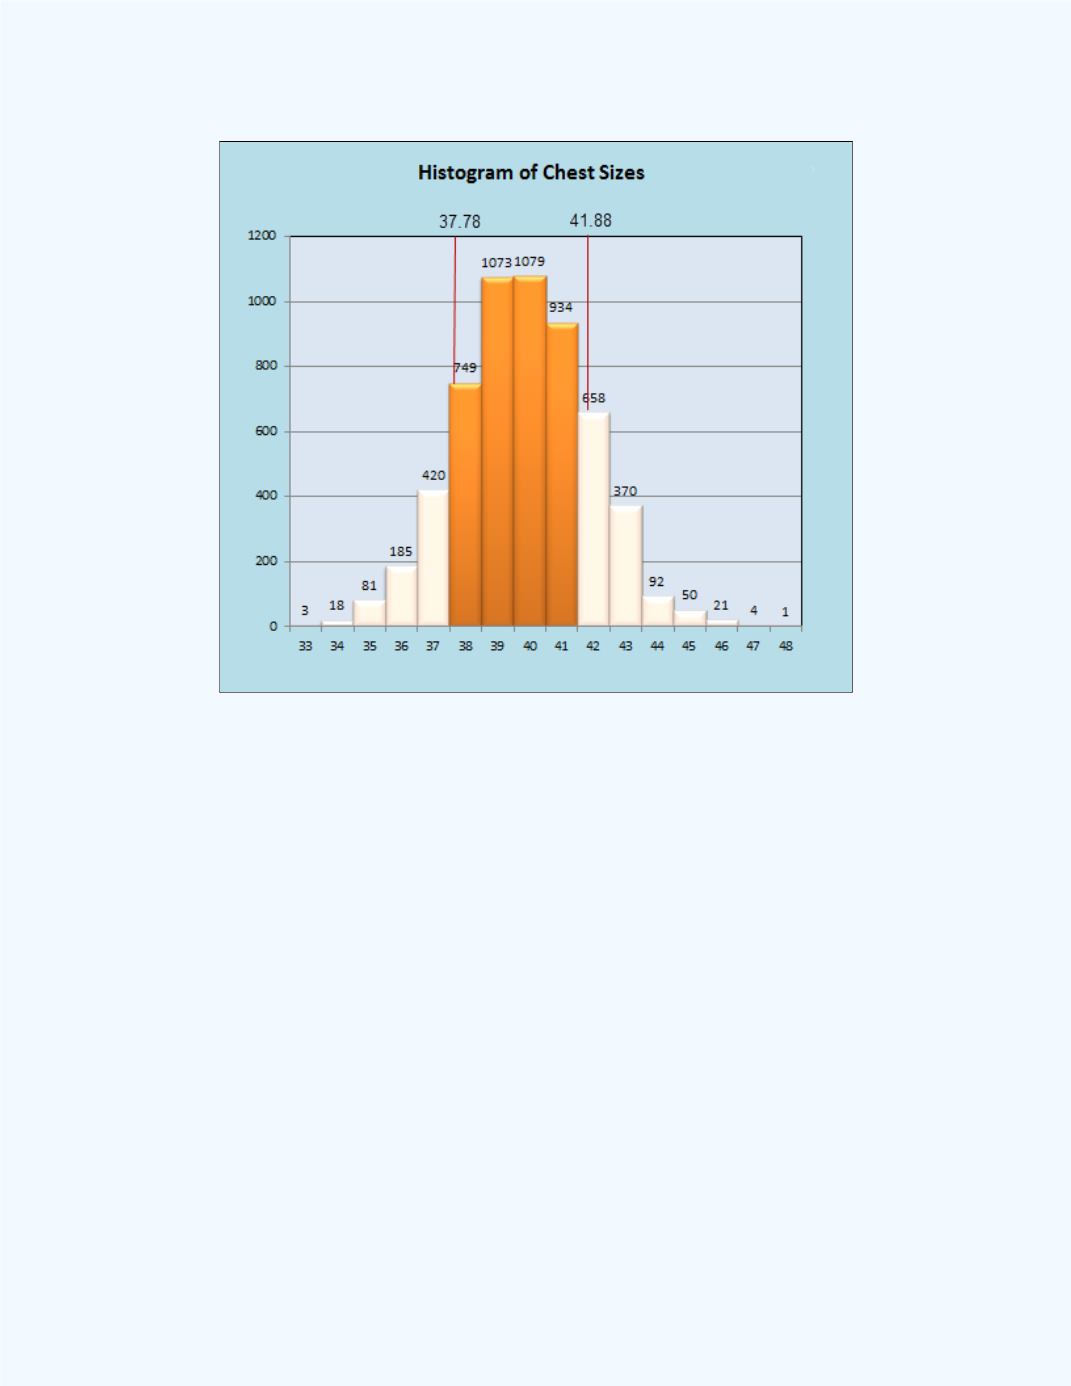
Figure 3-21:
Range of values to be included for the
One-sigma rule for the Chest Size data
The computed relative frequencies (probabilities) to be included in the
computations are displayed in
Figure 3-22
. The sum of the corresponding
relative frequencies is 0.1305 + 0.1870 + 0.1881 + 0.1628 = 0.6684
0.67. Refer to
Figure 3-22
for the computed probabilities. That is,
approximately 67% (close to 68%) of the values lie within one standard
deviation of the mean
.