


 133 / 762

Chapter 3: Measures of Variability
133
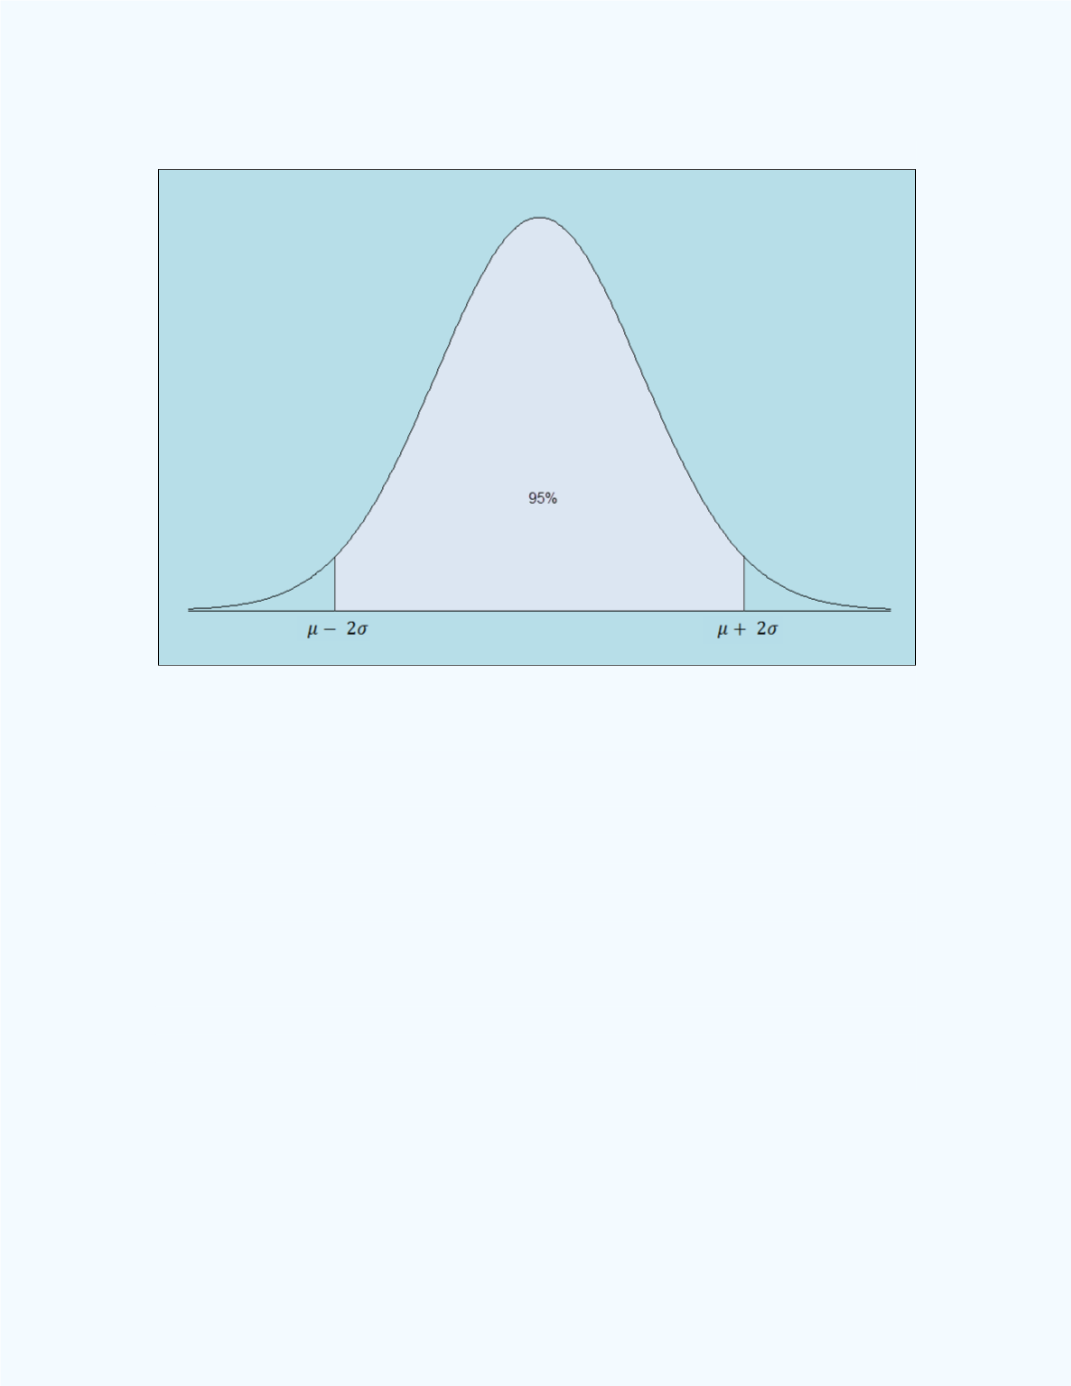
Figure 3-23:
Illustration of the two sigma rule
Numerical Illustration for the Two Sigma Rule
Recall the chest size data given above. The distribution for this data set is
displayed in
Figure 3-24
along with
red vertical lines
at
=
39.832 – 2
2.05 = 35.732 and
= 39.832 + 2
2.05 = 43.932.
Observe that the chest size values to be included in the computations range
from 36 to 43based on which vertical bars are to be included from the
histogram. The sum of the corresponding relative frequencies is
approximately 0.9530. Refer to
Figure 3-25
for the computed probabilities.
That is, approximately 95.3% (close to 95%) of the values lie within two
standard deviations of the mean.