


 129 / 762

Chapter 3: Measures of Variability
129
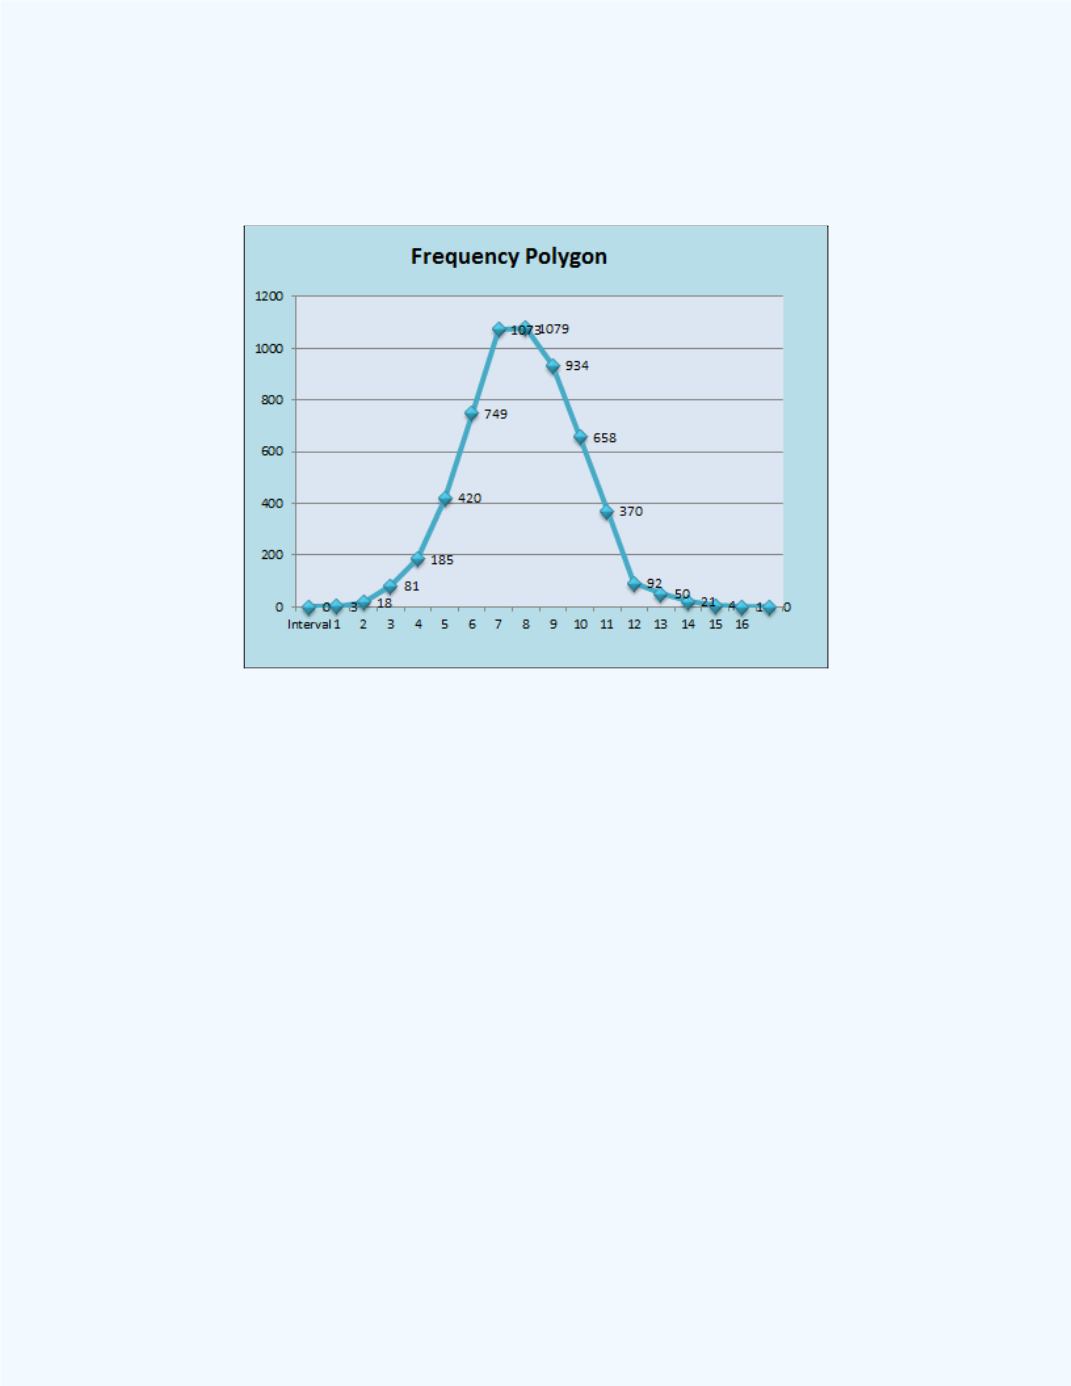
Figure 3-19
shows a frequency polygon for the data. Observe, again, the
general bell- shaped nature of the distribution for the chest sizes.
Figure 3-19:
Histogram for the Chest Size Data with
Superimposed Smooth Curve
Next we will establish the one, two, and three sigma rules which make up
the
Empirical Rule
for bell-shaped distributions.
One Sigma Rule
Approximately 68 percent of the data values will lie within one standard
deviation of the mean for
any
bell-shaped distribution. That is, regardless of
the values for the mean and standard deviation of the distribution, the
likelihood that the variable will be within one standard deviation of the mean
is approximately equal to 0.68. This means that approximately 32% of the
values will lie outside of one standard deviation of the mean. Thus, if we
sample from a bell-shaped population we should expect approximately one
in every three of the values will lie outside one standard deviation of the
mean. Equivalently, we should expect about two out of every three values
will lie within one standard deviation of the mean. The one sigma rule is
graphically illustrated in
Figure 3-20
.