


 130 / 762

130
Chapter 3: Measures of Variability
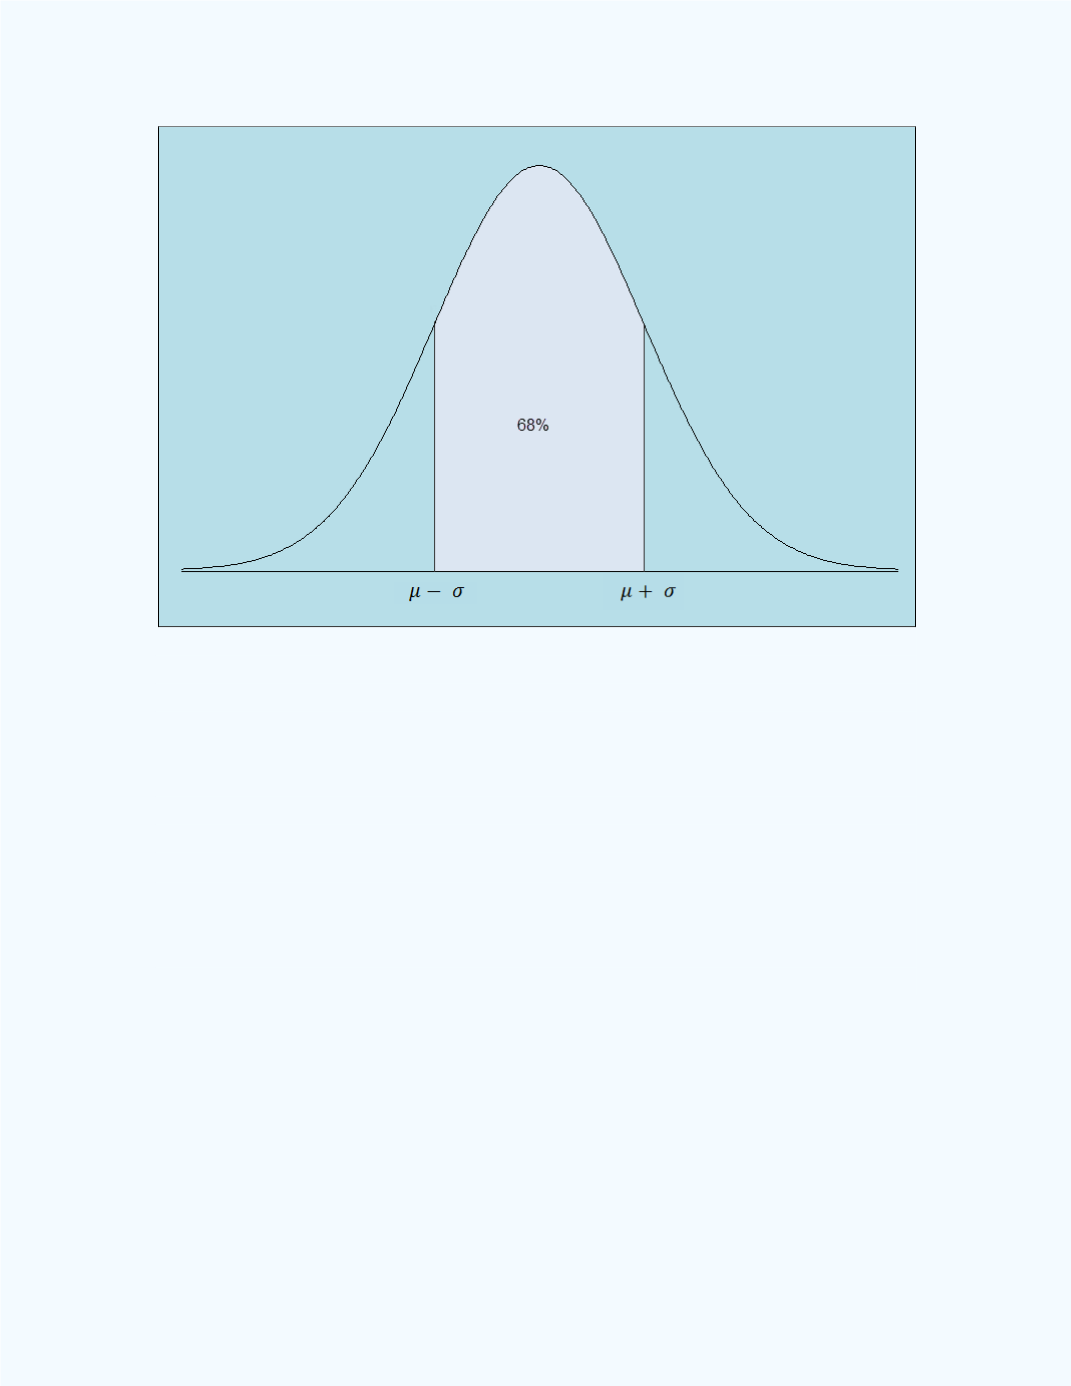
Figure 3-20:
Illustration of the One Sigma Rule
Numerical Illustration for the One Sigma Rule
Recall the chest size data given above and from
Figure 3-18
and
Figure 3-
19
, one may assume an approximate bell shape distribution for the data set.
The distribution for this data set is displayed in
Figure 3-21
along with
red
vertical lines
at
= 39.832 – 1
2.05 = 37.782 and at
=
39.8318 + 2.0494 = 41.882. Observe that the chest size values to be
included in the computations ranges from 38 to 41based on which vertical
bars to be included from the histogram. Refer to
Figure 3-21
.