


 138 / 762

138
Chapter 3: Measures of Variability
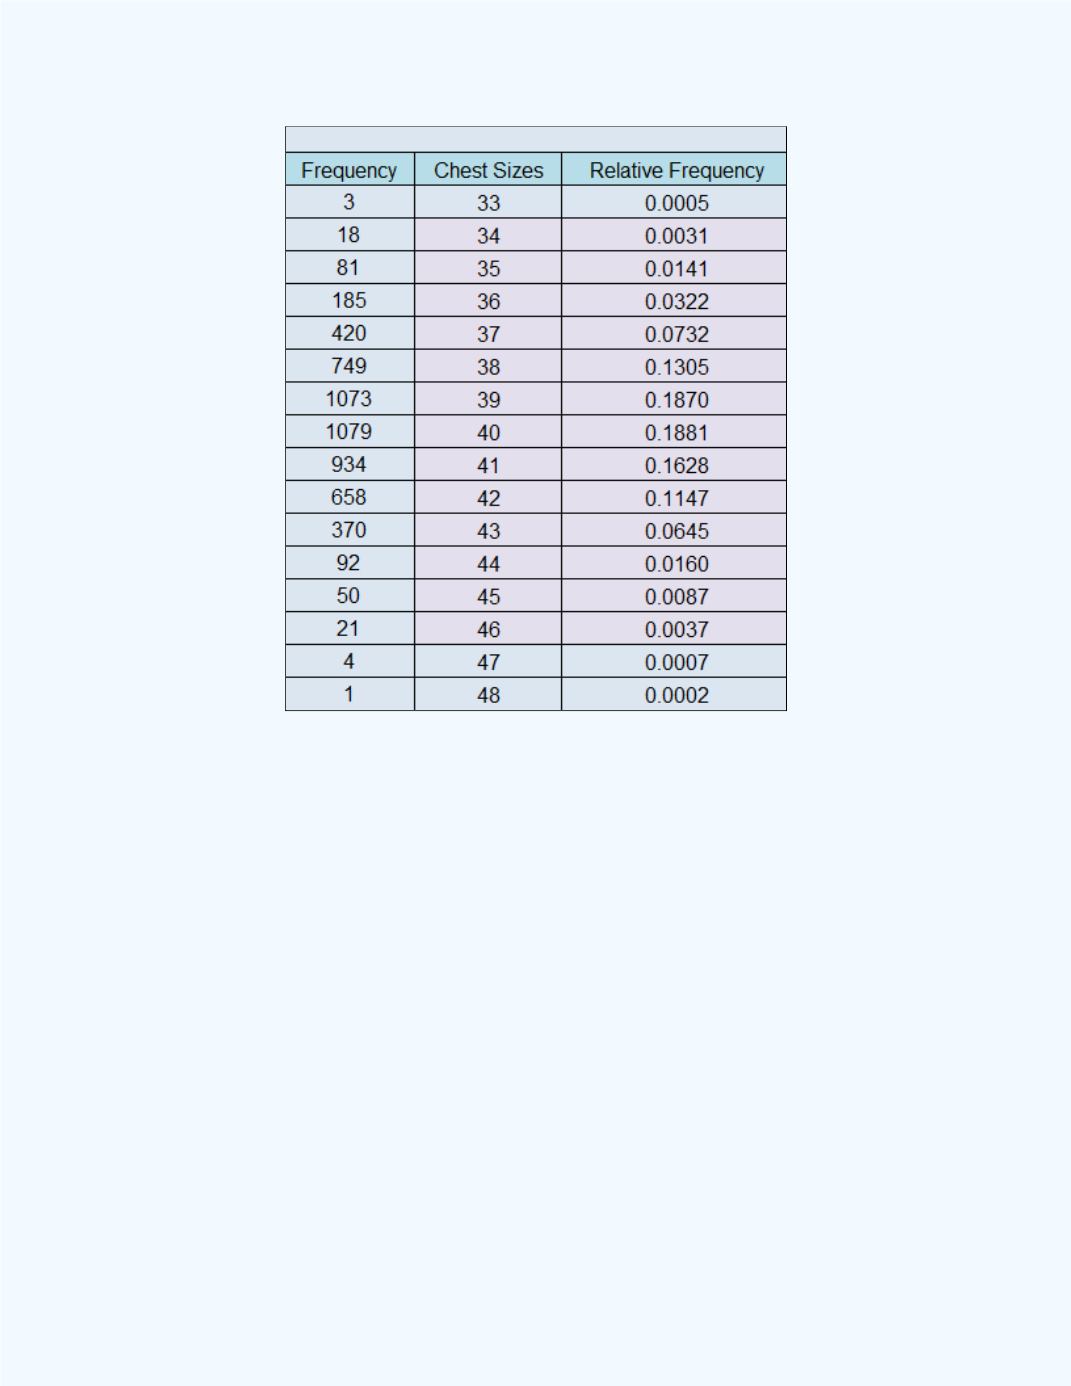
Figure 3-28:
Computed probabilities
to be included
for the Three-sigma rule for the Chest Size
data
Example 3-15:
A portfolio of Internet stocks had an average cost per
share of $46.20 with a standard deviation of $10.11. If the distribution of
the data is bell-shaped, what interval will contain approximately 95 percent
of the stock prices?
Solution:
Using the two-sigma rule, 95 percent of the data will be included
in the interval of $46.20 ± 2
$10.11= $46.20 ± $20.22. The lower limit of
the interval is $46.20 - $20.22 = $25.98, and the upper limit of the interval is
$46.20 + $20.22 = $66.42. Thus, 95 percent of the stock prices should fall
between $25.98 and $66.42.