


 140 / 762

140
Chapter 3: Measures of Variability
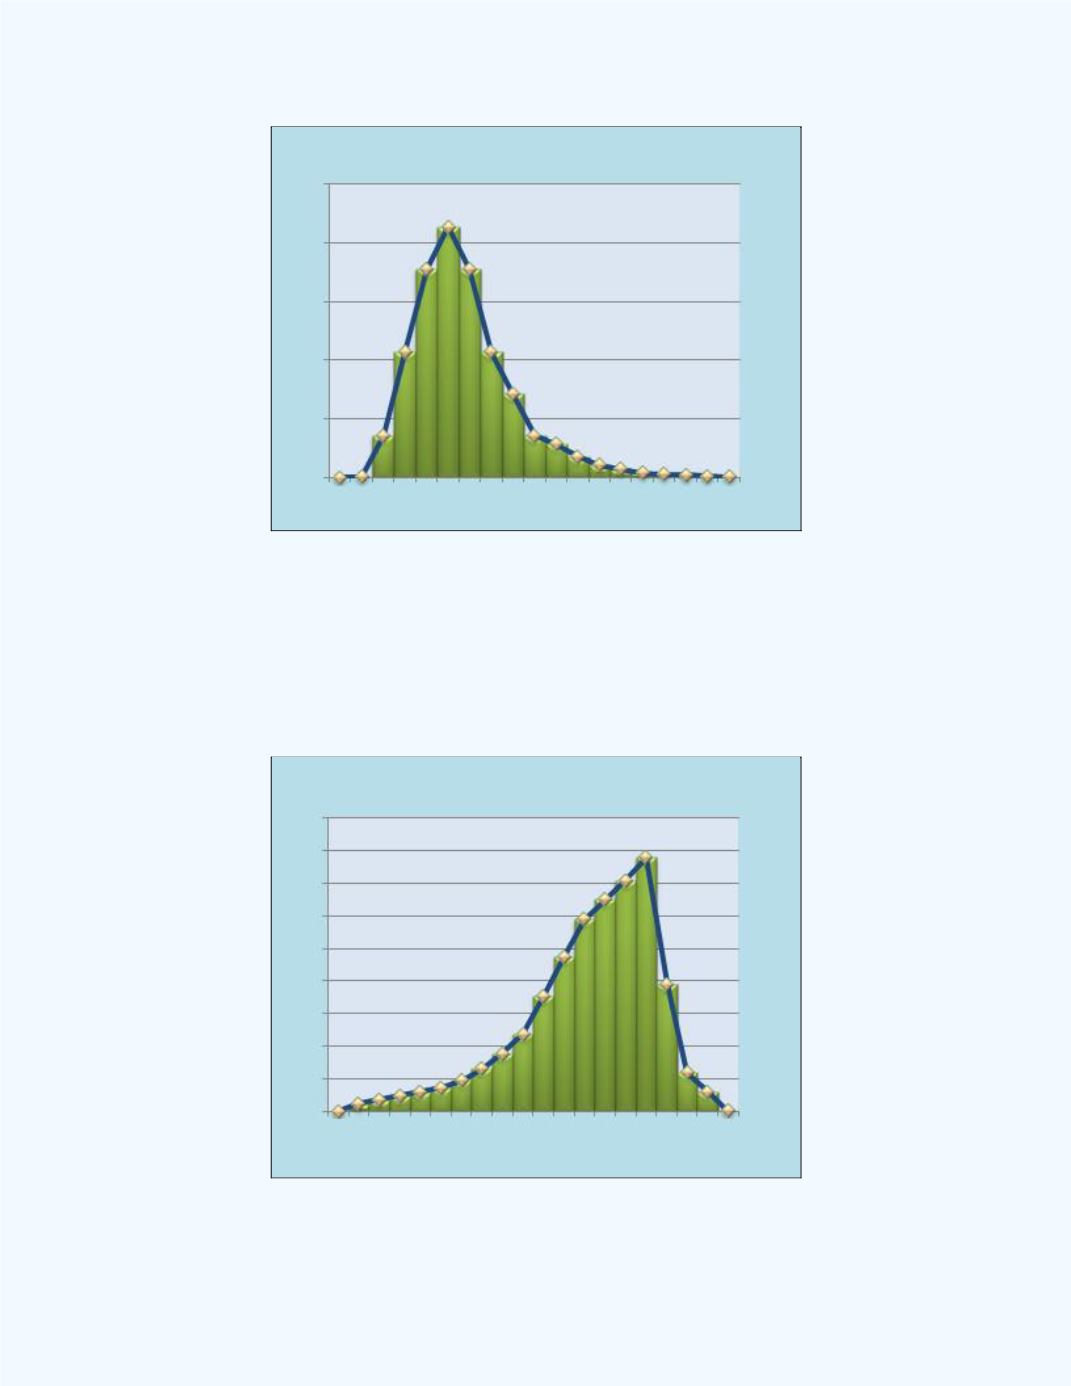
Figure 3-30:
Right or Positively Skewed Distribution
For a
negatively (left) skewed distribution:
Mean < Median < Mode.
Figure 3-31
displays an example of a right skewed distribution.
Figure 3-31:
Left or Negatively Skewed Distribution