


 162 / 762

162
Chapter 4: Measures of Position
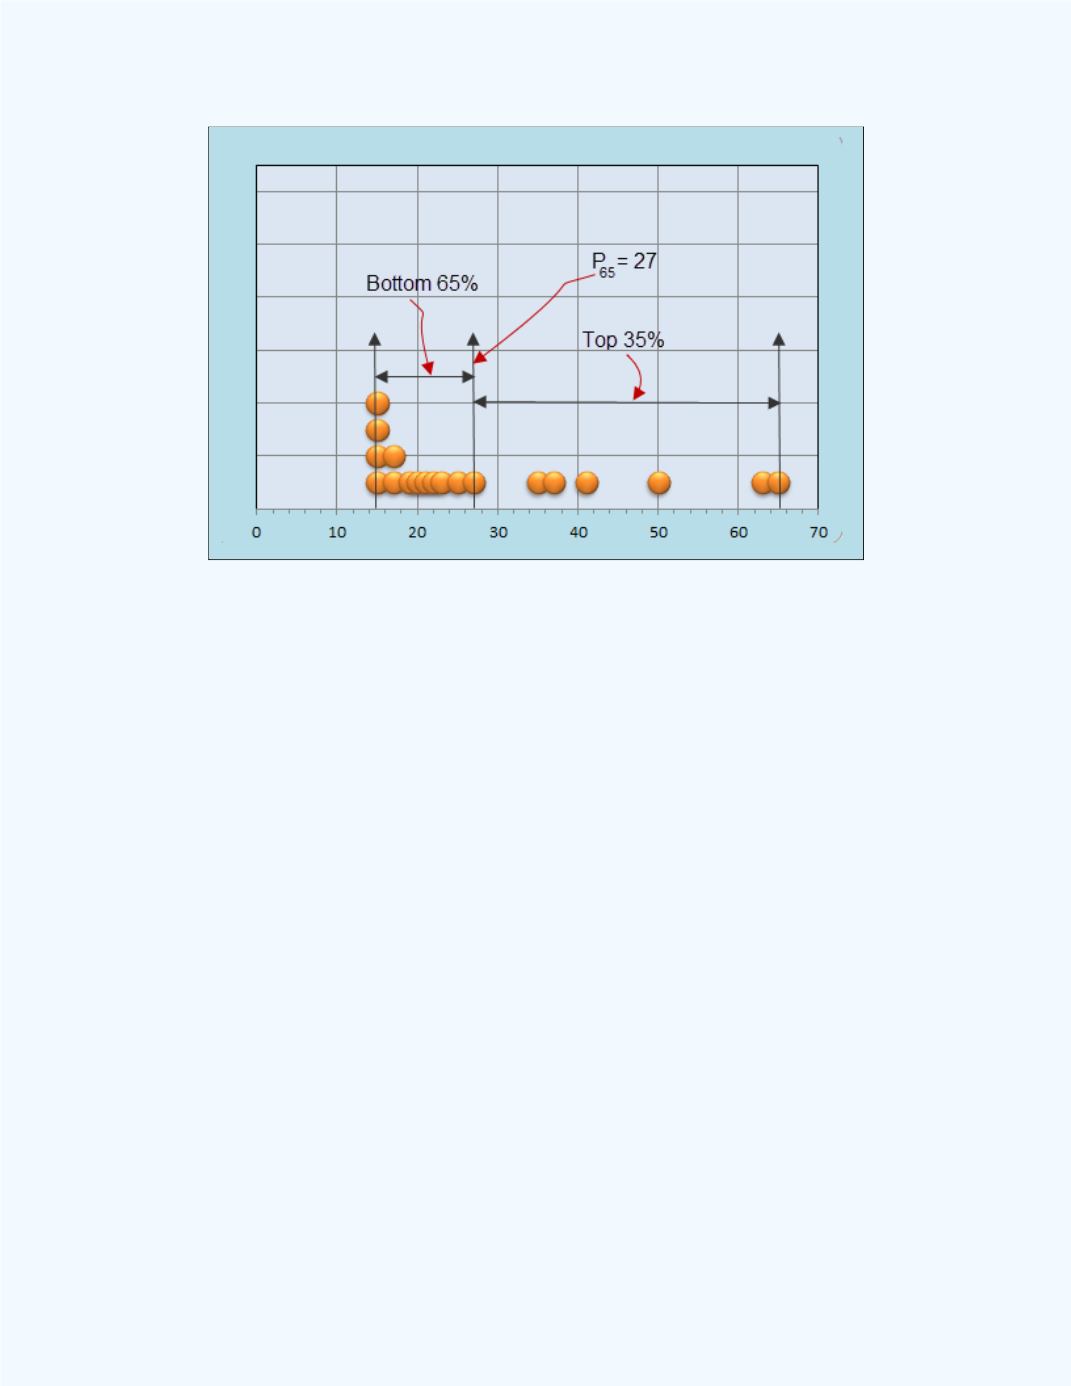
Figure 4-12:
Dot Plot of the data points with the
location of
P
65
for
Example 4-6
Example 4-7:
Find the 25
th
percentile for the following data set:
6 12 18 12 13 8 13 11 10 16 13 11 10 10 2 14
Solution:
First, we need to arrange the data set in order from the minimum
value to the maximum value. The ordered set is given below.
2 6 8 10 10 10 11 11 12 12 13 13 13 14 16 18
Next, we need to compute the position number of the percentile. Since
= 16, and
= 25, then
= (16
25)/100 = 4. Since
is a whole number, in
this case it is 4, then the 25
th
percentile will be computed from the average of
the values located at the 4
th
and the 5
th
positions in the ordered set. The 4
th
value corresponds to the value of 10, and the 5
th
value corresponds to the
value of 10 as well. Hence,
= (10 + 10)/2 = 10.
Again we can use the
Basic Statistics
workbook to compute the answer.
The output is given in
Figure 4-13
. Note the data was entered in the Data 1
column in the workbook.