


 161 / 762

Chapter 4: Measures of Position
161
Next, we need to compute the position number of the percentile. Since
= 19 and
= 65, then
= (19
65)/100 = 12.35. Since
is not a whole
number we need to round up to the next whole number which is 13. Thus,
the 13
th
value in the ordered data set will correspond to the 65
th
percentile.
That is,
= 27.
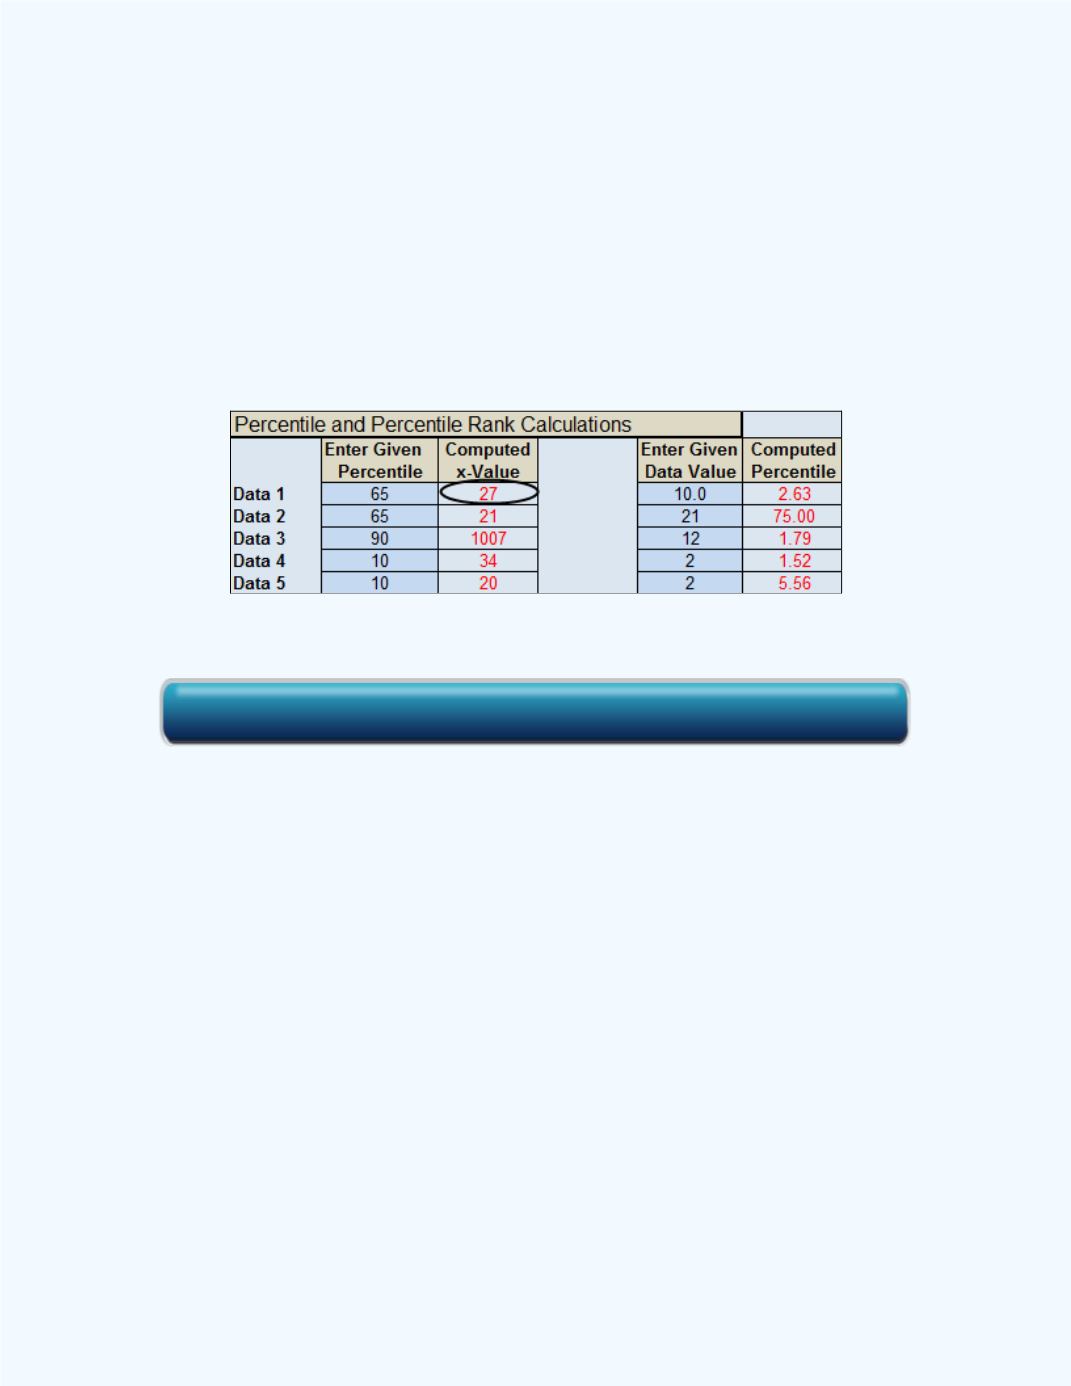
We can use the
Basic Statistics
workbook to compute the answer. The
output is given in
Figure 4-11
. Note the data was entered in the Data 1
column in the workbook.
Figure 4-11:
Computed percentile for
Example 4-6
Question:
Why is a percentile considered a measure of position?
The following discussion, using the information for
Example 4-6
, will give
an insight into the question.
Figure 4-12
shows a plot of the data points
with the location of the 65
th
percentile value of 27. Observe that the value of
27 is such that at most 65% of the data values are smaller than 27 and at
most 35% of the values are larger than 27. Thus, this illustrates that the
percentile value of 27 is a measure of location. That is, the percentile gives
us an idea of the relative position of a value in an ordered data set.
Click here for the Basic Statistics Workbook