


 156 / 762

156
Chapter 4: Measures of Position
Finding the Percentile Corresponding to a Given Data Value
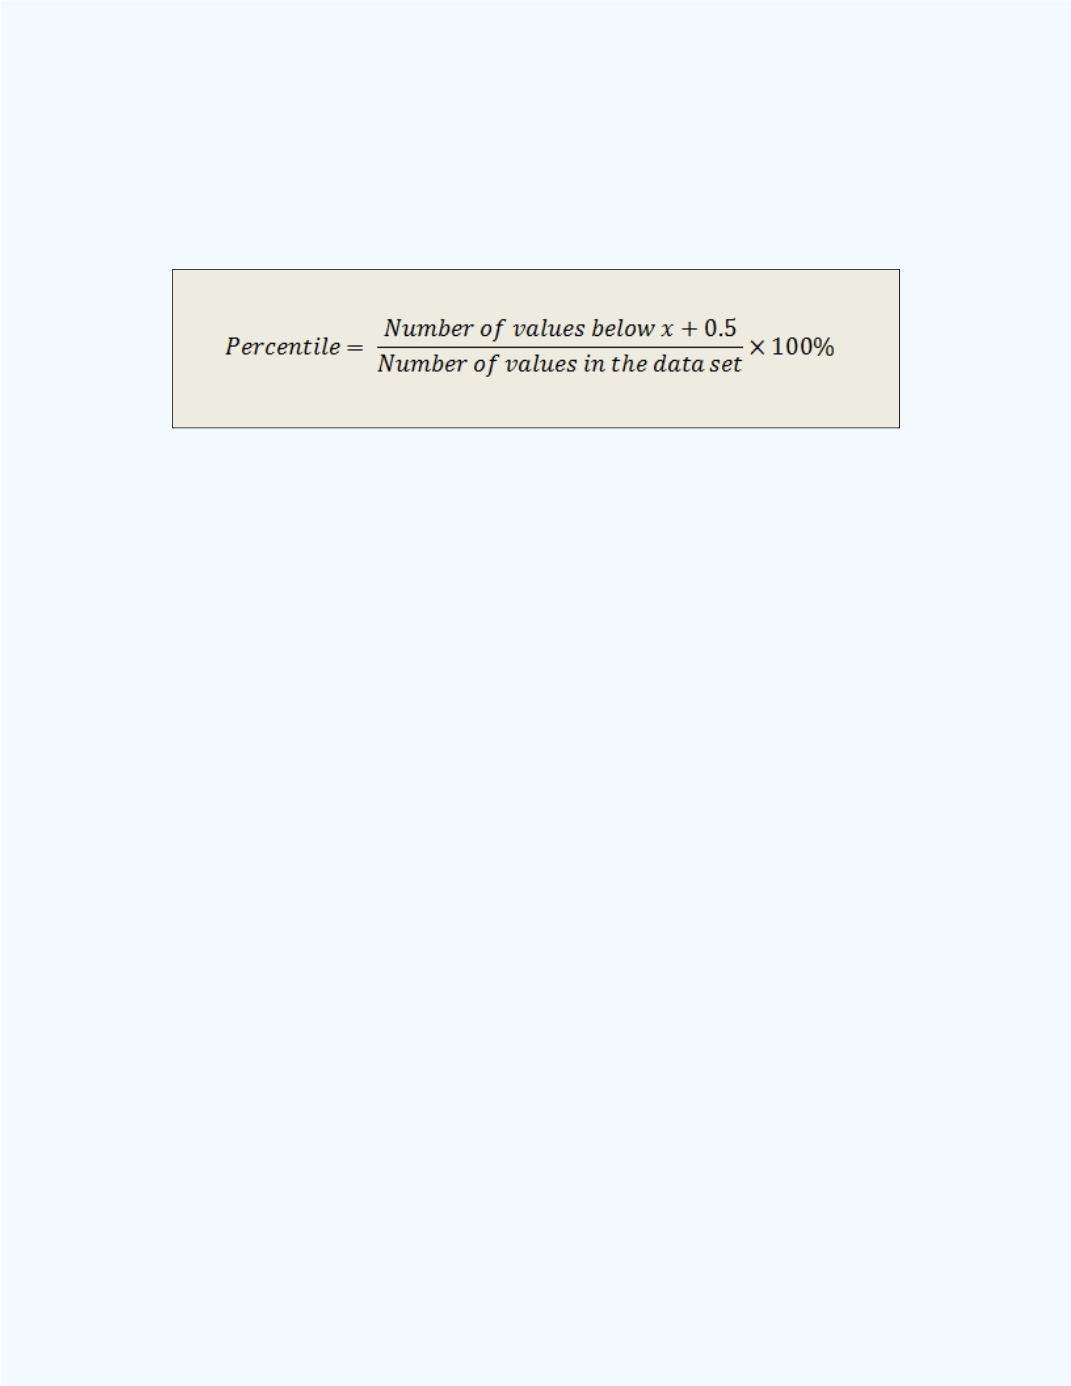
The percentile corresponding to a given data value, say
x
, in a data set is
obtained by using the following formula.
In the above equation, some authors will multiply 0.5 in the numerator by
the frequency count of
. By doing this, they are dividing the number of
values of
by half. Thus, when the percentile is found, there will be at least
one of the values of
which will be above the computed percentile when the
frequency count for
is at least two. However, based on the explanation of
the
percentile, this procedure will not fit exactly.
If we view the dot plot for the data set and if there are repeated values for
,
then these values will be stacked above the value of
. The explanation of
the
percentile will apply appropriately here. Thus the 0.5 in the equation
can be viewed as a “correction factor” which helps to include
in the “at
most” term in the explanation of the
percentile. In this e-book, we will
use the latter view and so we will leave the equation as it is presented above.
Example 4-3:
The shoe sizes, in whole numbers, for a sample of 12 male
students in a statistics class were as follows:
13 11 10 13 11 10 8 12 9 9 8 9
What is the percentile rank for a shoe size of 12?
Solution:
First, we need to arrange the values from the minimum value to
the maximum value. This ordered set is given below:
8 8 9 9 9 10 10 11 11 12 13 13