


 155 / 762

Chapter 4: Measures of Position
155
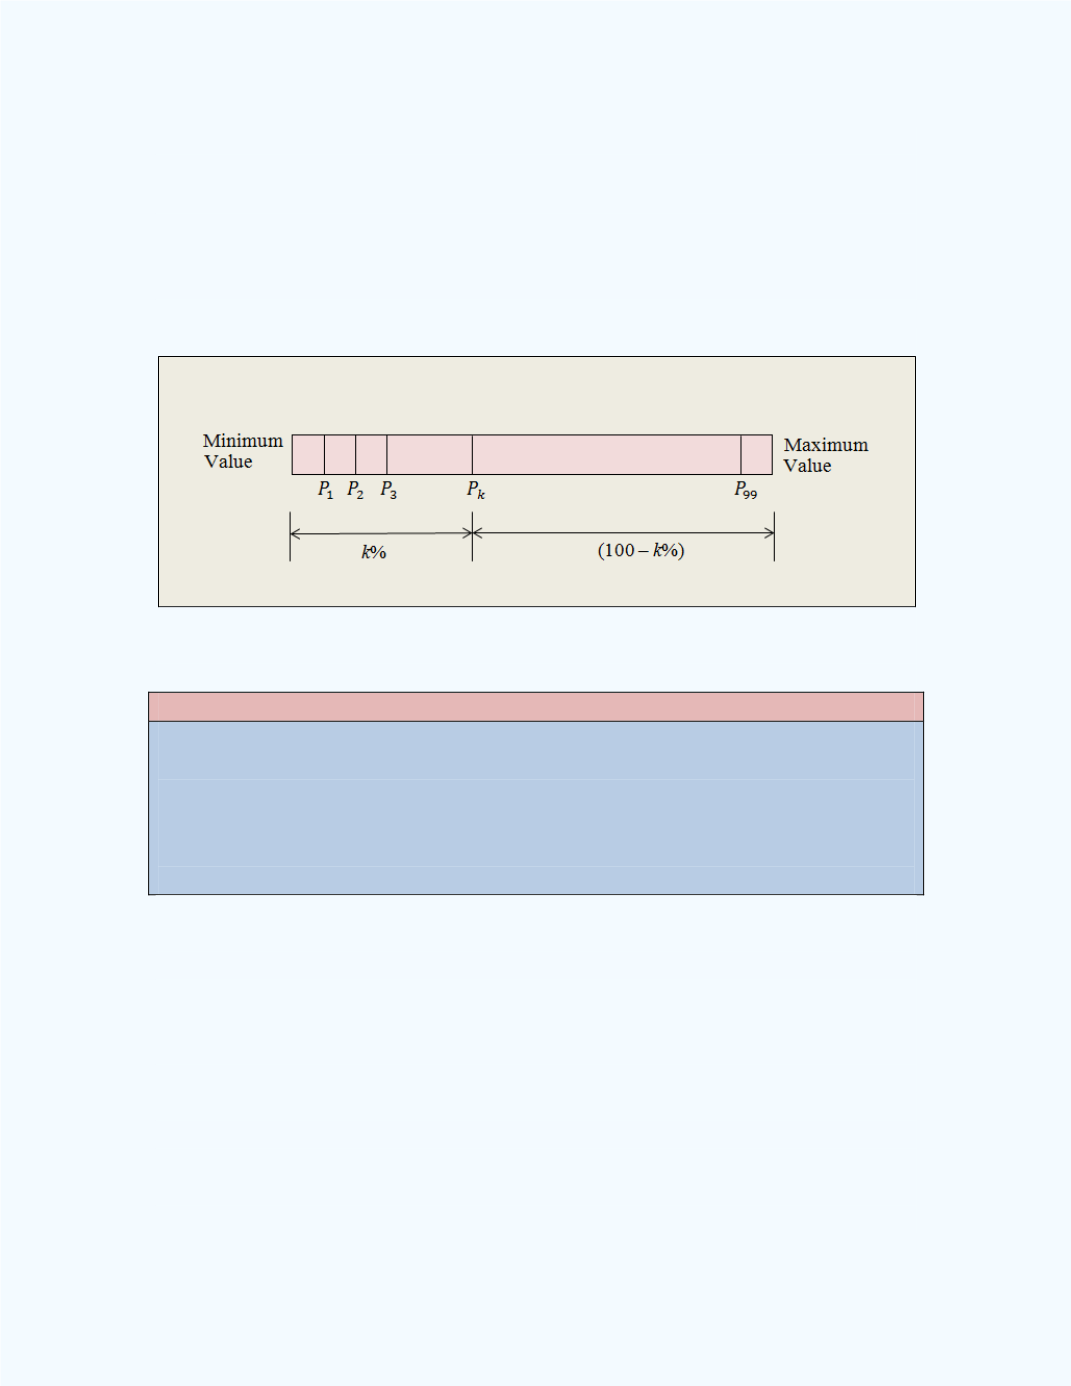
When we discuss percentiles, we generally present the discussion through
the
percentile. Let the
percentile be denoted by
. Then the
percentile for an ordered array of data is that numerical value
such that at
most
% of the data values is smaller than
, and at most (100 –
)% of
the data values is larger than
. The idea of the
percentile is illustrated
in
Figure 4-7
.
Figure 4-7:
Illustration of the
k
th
percentile
Notes:
In order for a percentile to be determined, the data set first must be
ordered from the minimum value to the maximum value.
There are 99 percentiles in a data set.
Again, when you were given your ACT or SAT percentile rankings, maybe
you wondered what your actual score was on the exam. Next we will
discuss a general procedure as to how the percentile rankings were computed
for your scores. That is, given a data value in a data set, what is the
corresponding percentile ranking for that value?
Note:
The procedure presented here is just one of many ways of
determining the percentile for a given value in a data set.