


 152 / 762

152
Chapter 4: Measures of Position
the
Basic Statistics
workbook to compute these values.
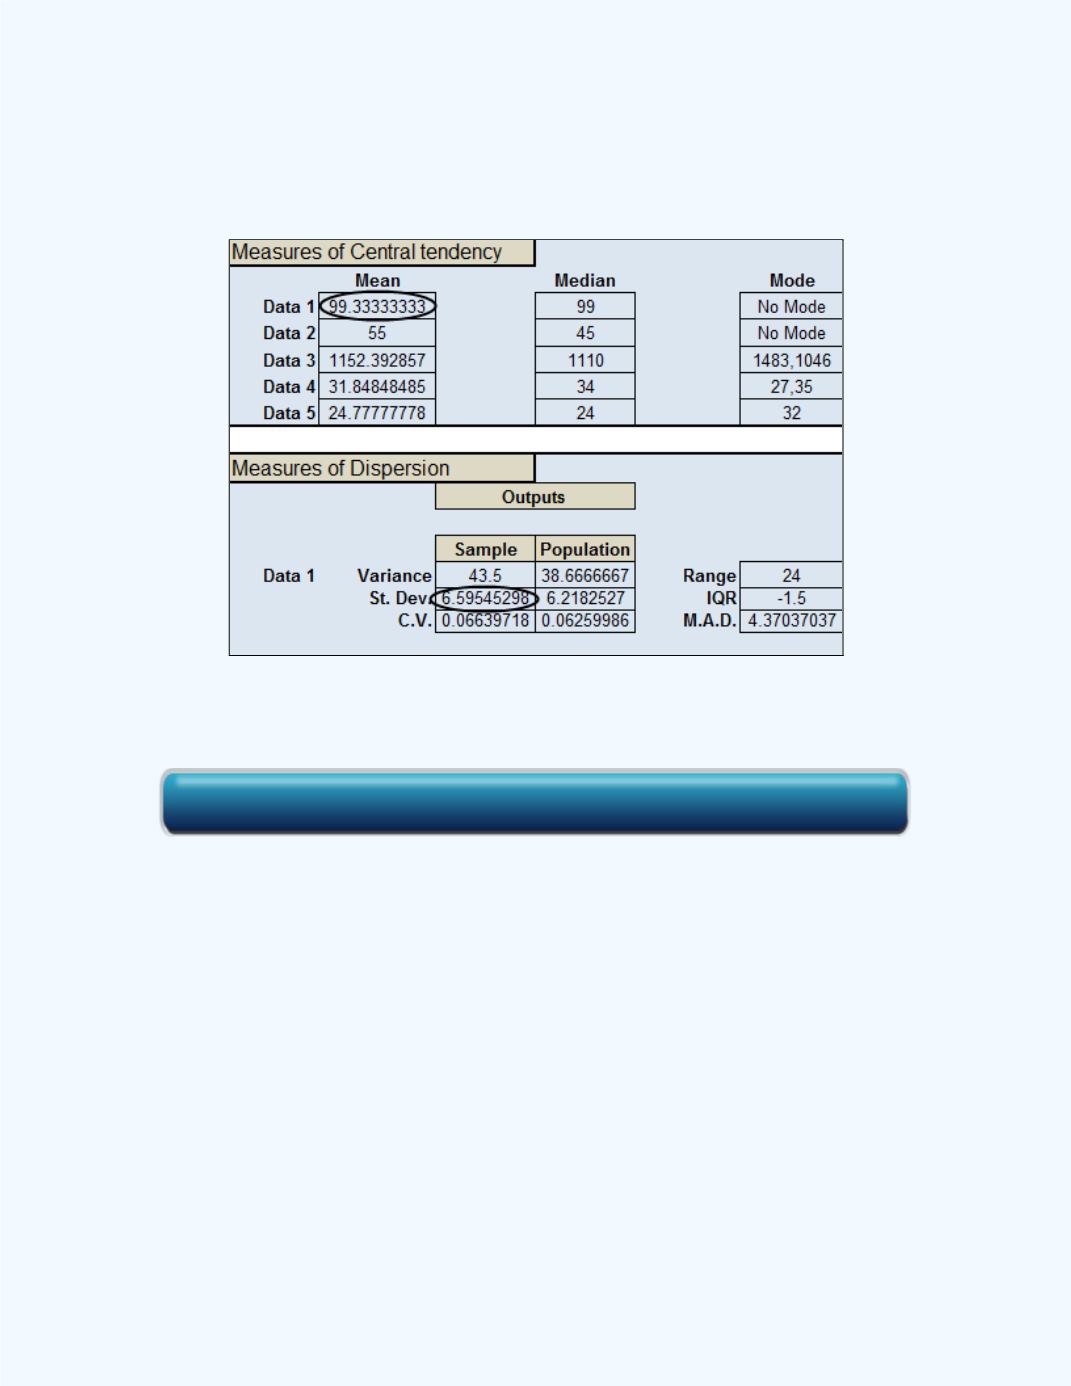
Figure 4-4
shows
these values when the values are entered into the Data 1 column of the
workbook.
Figure 4-4:
Computed Mean and Standard Deviation
for
Example 4-2
Thus the
-score for the sample value of 90 is:
-score = (90 – 99.3333)/6.5955 = -1.4151 (to four decimal places)
Thus the
-score is approximately equal to -1.42. That is, the data value of
90 is located approximately 1.42 standard deviations
below
the mean of
99.3333, since the
-score is negative.
We can use the
Basic Statistics
workbook to also give the result. The
workbook result is shown in
Figure 4-5
when the data was entered into the
Data 1 column in the workbook.
Click here for the Basic Statistics Workbook