


 19 / 762

Chapter 1: Introduction and Graphical Displays
19
We can use the
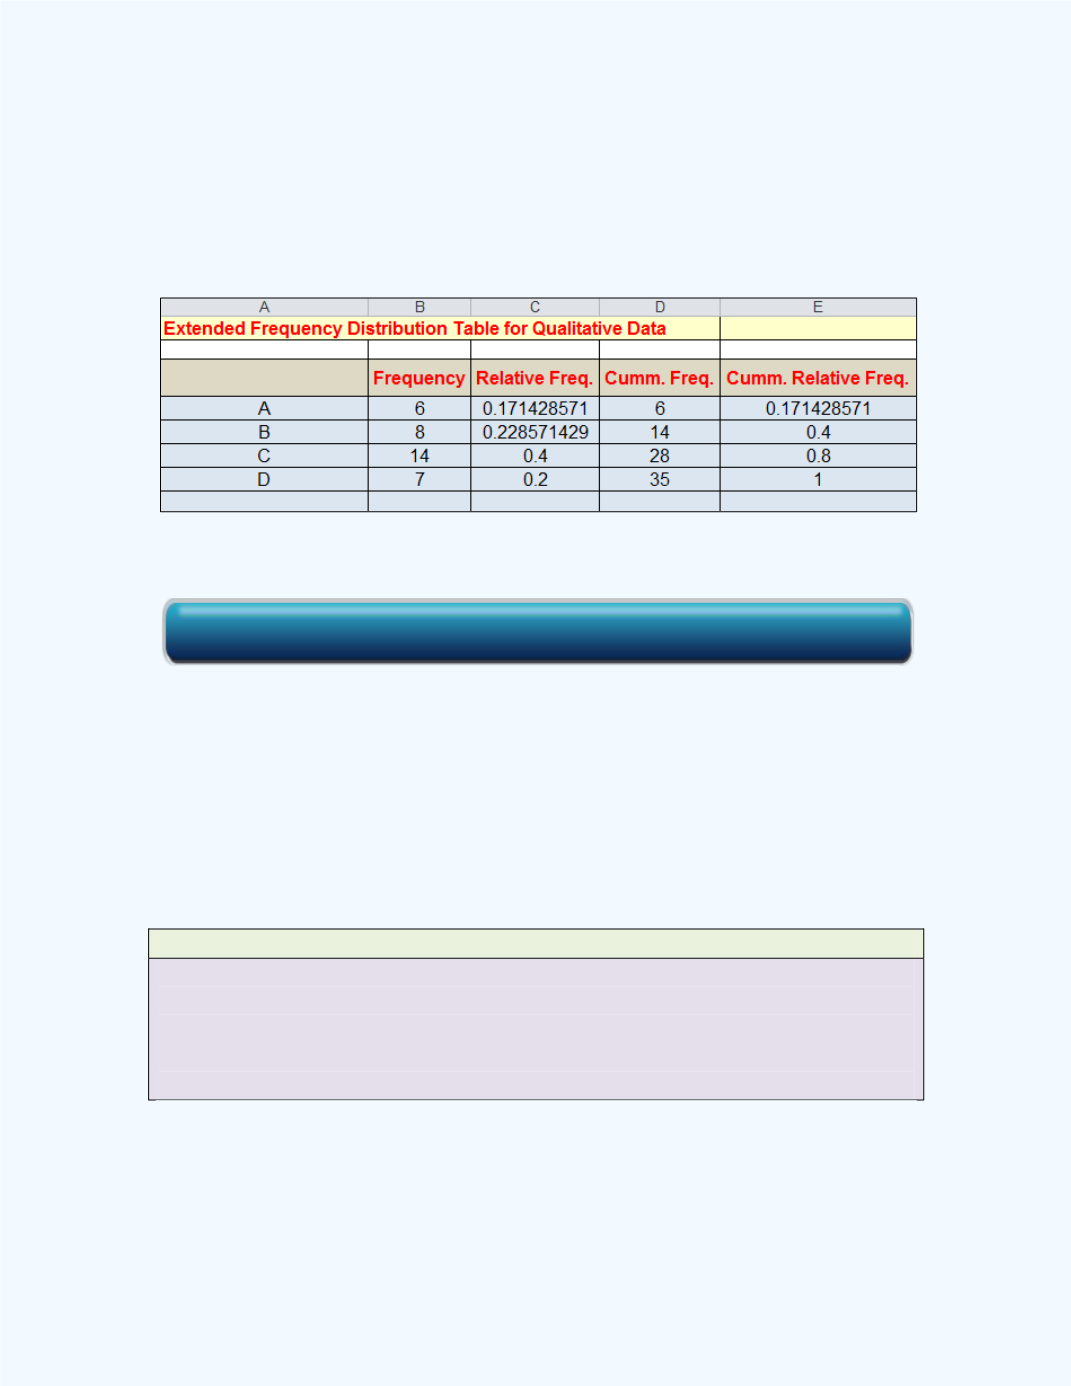
Extended Frequency Table for Qualitative Data
workbook to create
Table 1-1
. The results are shown in
Figure 1- 9
.
Observe that the information in
Table 1-1
is
listed in the first two columns
in the output. Ignore the other three columns of information for the time
being. These will be discussed later in this section.
Figure 1-9:
Frequency Table for
Example 1-1
Quantitative Frequency Distributions – Ungrouped (Discrete)
If we have raw data in which the values are discrete and the range of the
values is not large, then one may summarize such data with a frequency
distribution by listing the actual values. Since we will be displaying the
actual data values with their corresponding frequencies in a table, we call
such a table an ungrouped frequency distribution.
Definition: Ungrouped or Discrete Frequency Distribution
An ungrouped or discrete frequency distribution simply lists the data values
with the corresponding number of times or frequency count with which each
value occurs in tabular form.
Following is an example which deals with an ungrouped frequency
distribution.
Click here for the Extended Frequency Table for Qualitative Data Workbook