


 20 / 762

20
Chapter 1: Introduction and Graphical Displays
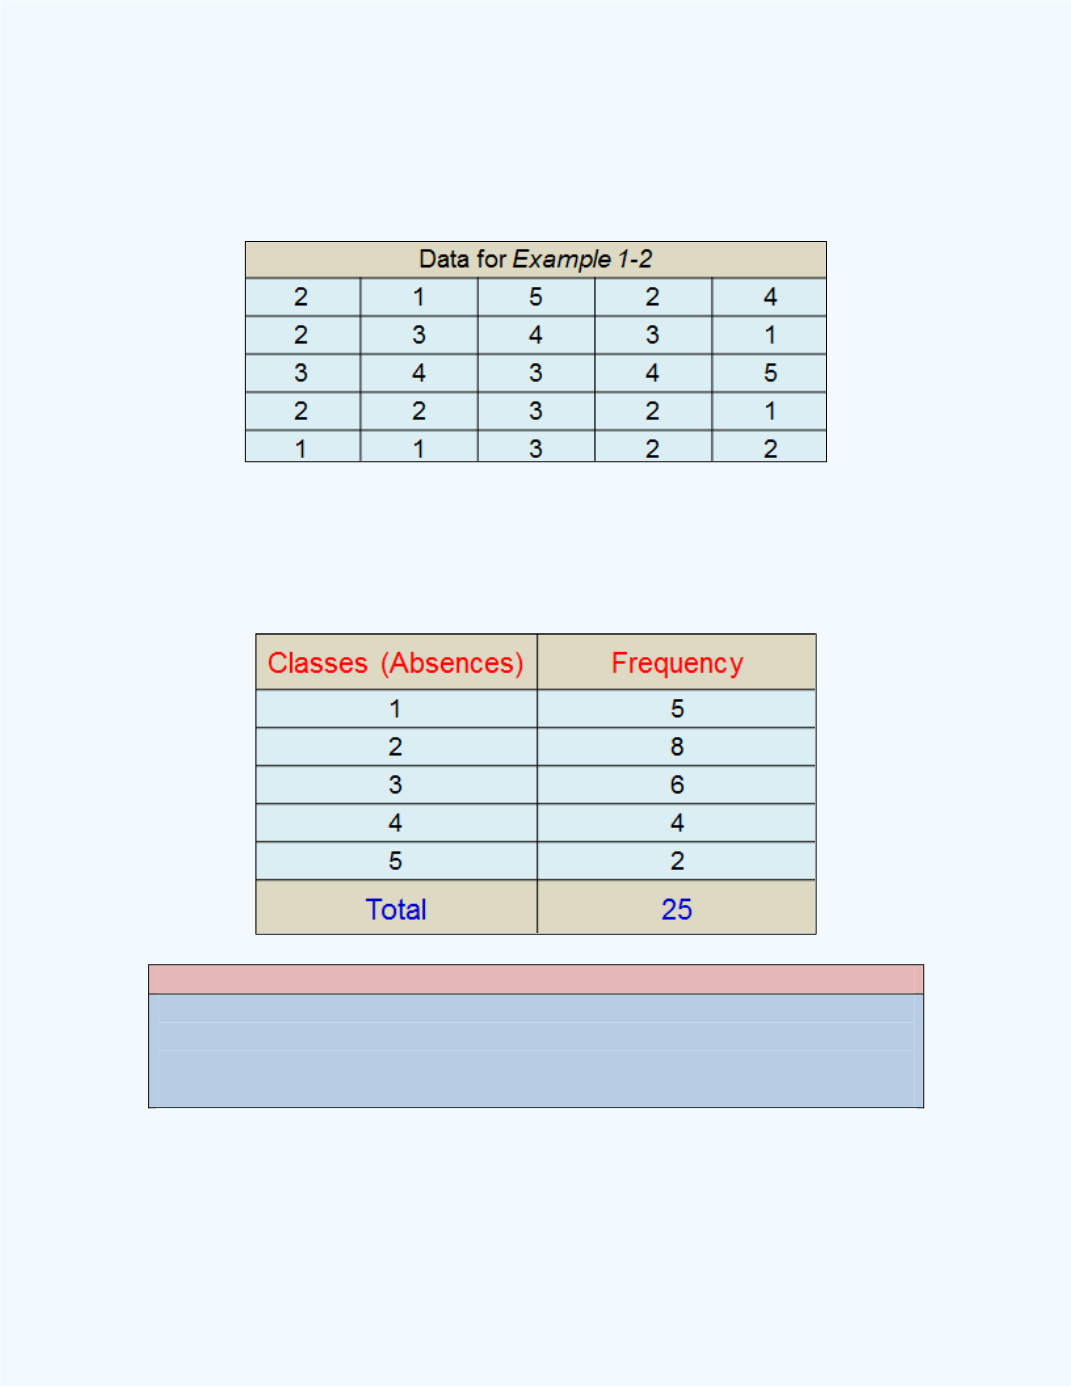
Example 1-2:
The following data represents the number of student
absences for a college course for a 25 day period. Summarize the
information with a frequency distribution.
Solution:
The ungrouped (discrete) frequency distribution for the number
of absences is shown in
Table 1-2
.
Table 1-2:
Frequency Table for
Example 1-2
Note:
Sometimes frequency distributions are displayed with the relative
frequencies as well.