


 325 / 762

Chapter 8: Discrete Probability Distributions
325
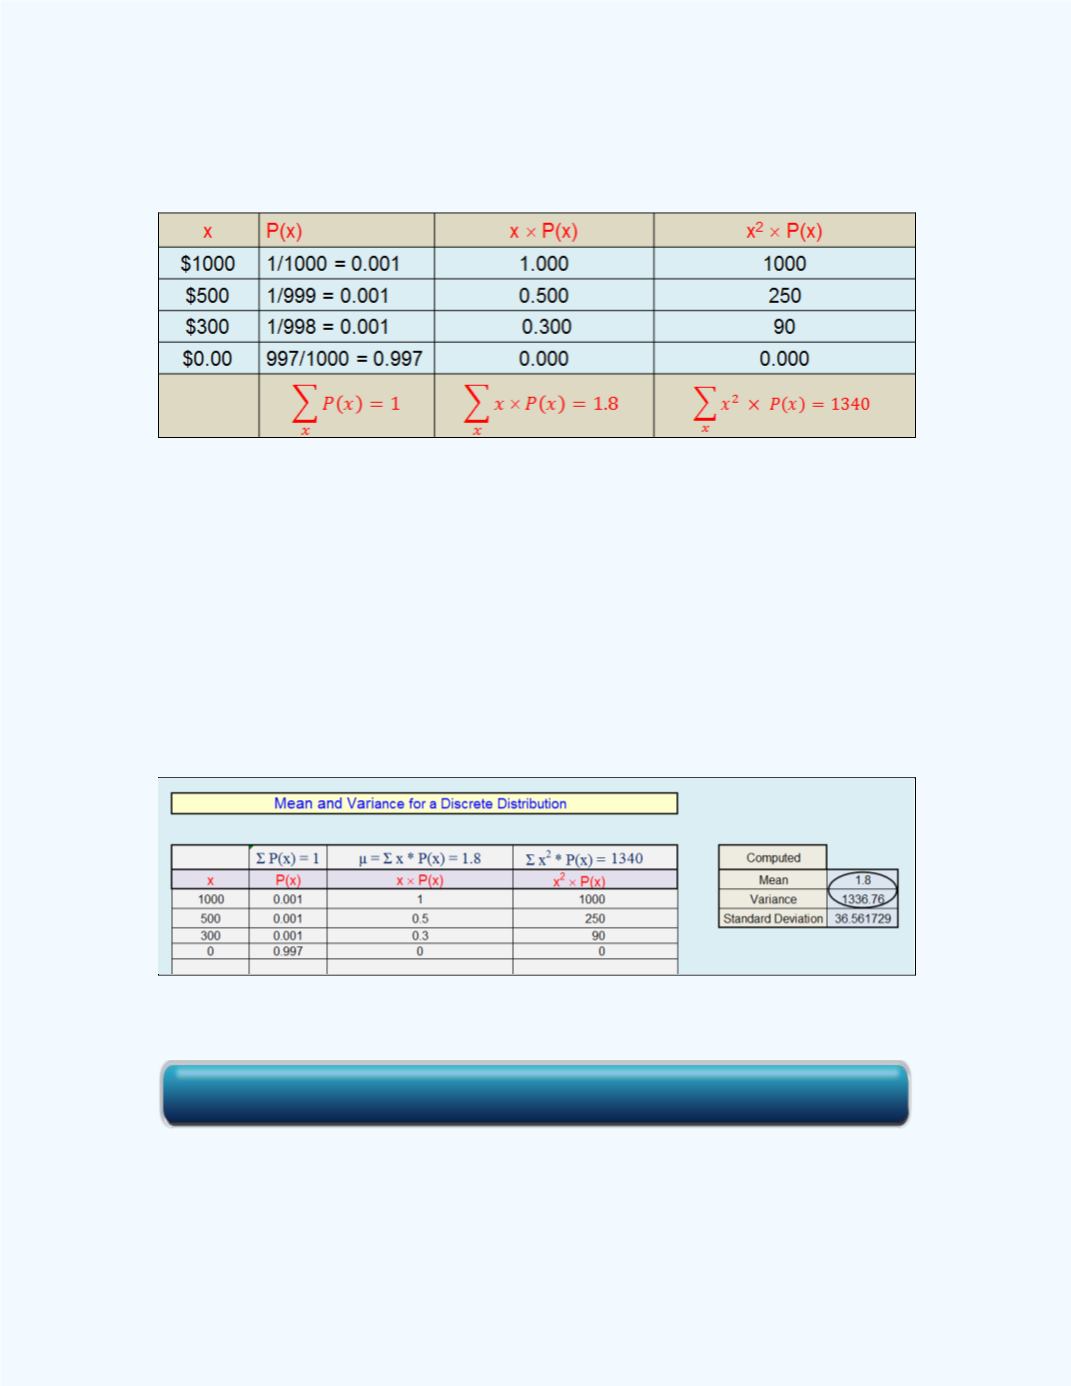
Table 8-10:
Probability Distribution, Expected value and Variance
computations for
Example 8-6
Thus, from
Table 8-8
, we see that from the table,
V
(
X
) =
∑
}
= 1340 – 1.8
2
= 1336.76 (square dollars).
Note:
Variances are measured in square units.
We can also use the
Mean and Variance for a Discrete Distribution
workbook to help with the computations.
Figure 8-11
shows the output
with the values for the computed mean and variance for the winnings for the
raffle.
Figure 8-11:
Mean and Variance for
Example 8-6
Example 8-7:
Find the variance for the gain in
Example 8-4
.
Solution:
If we let
X
be the amount of gain, then
Click here for the Mean and Variance Workbook