


 320 / 762

320
Chapter 8: Discrete Probability Distributions
8-5 Variance and Standard Deviation of a Discrete Random
Variable
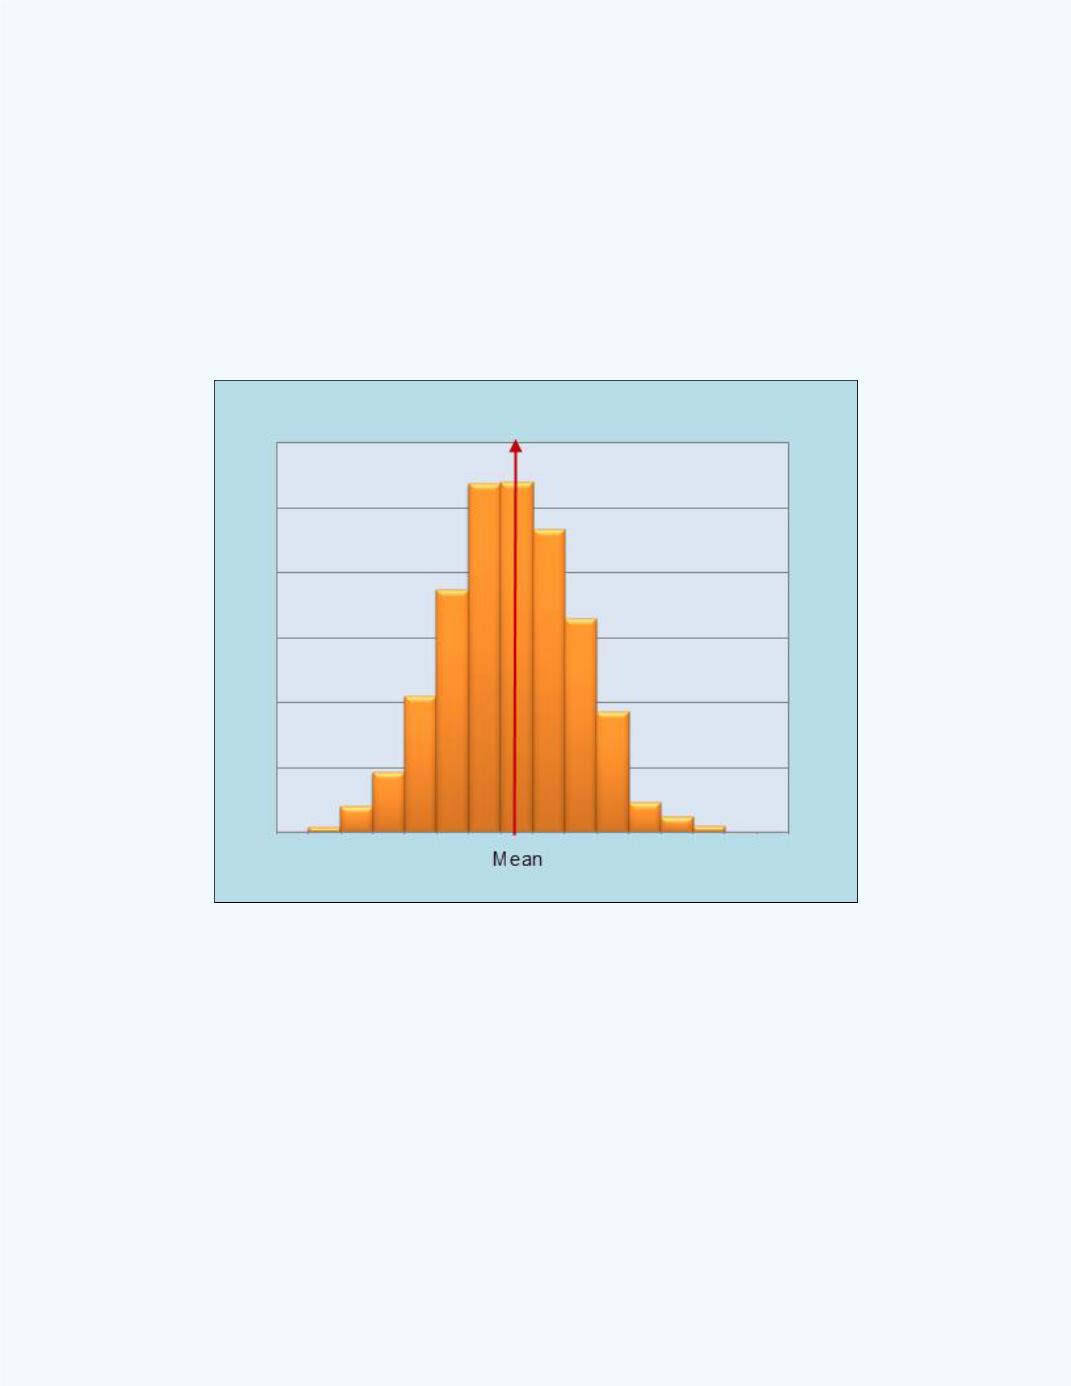
The following diagrams,
Figure 8-8
through
Figure 8-10
, show the shapes
of different distributions about the same mean for different random
variables. Observe that some are more spread out about the mean, while
others are more clustered about the mean. The spread gives us an idea about
the
variability
of the random variable about the mean.
Figure 8-8:
Distribution with a fair amount of
spread about the mean