


 315 / 762

Chapter 8: Discrete Probability Distributions
315
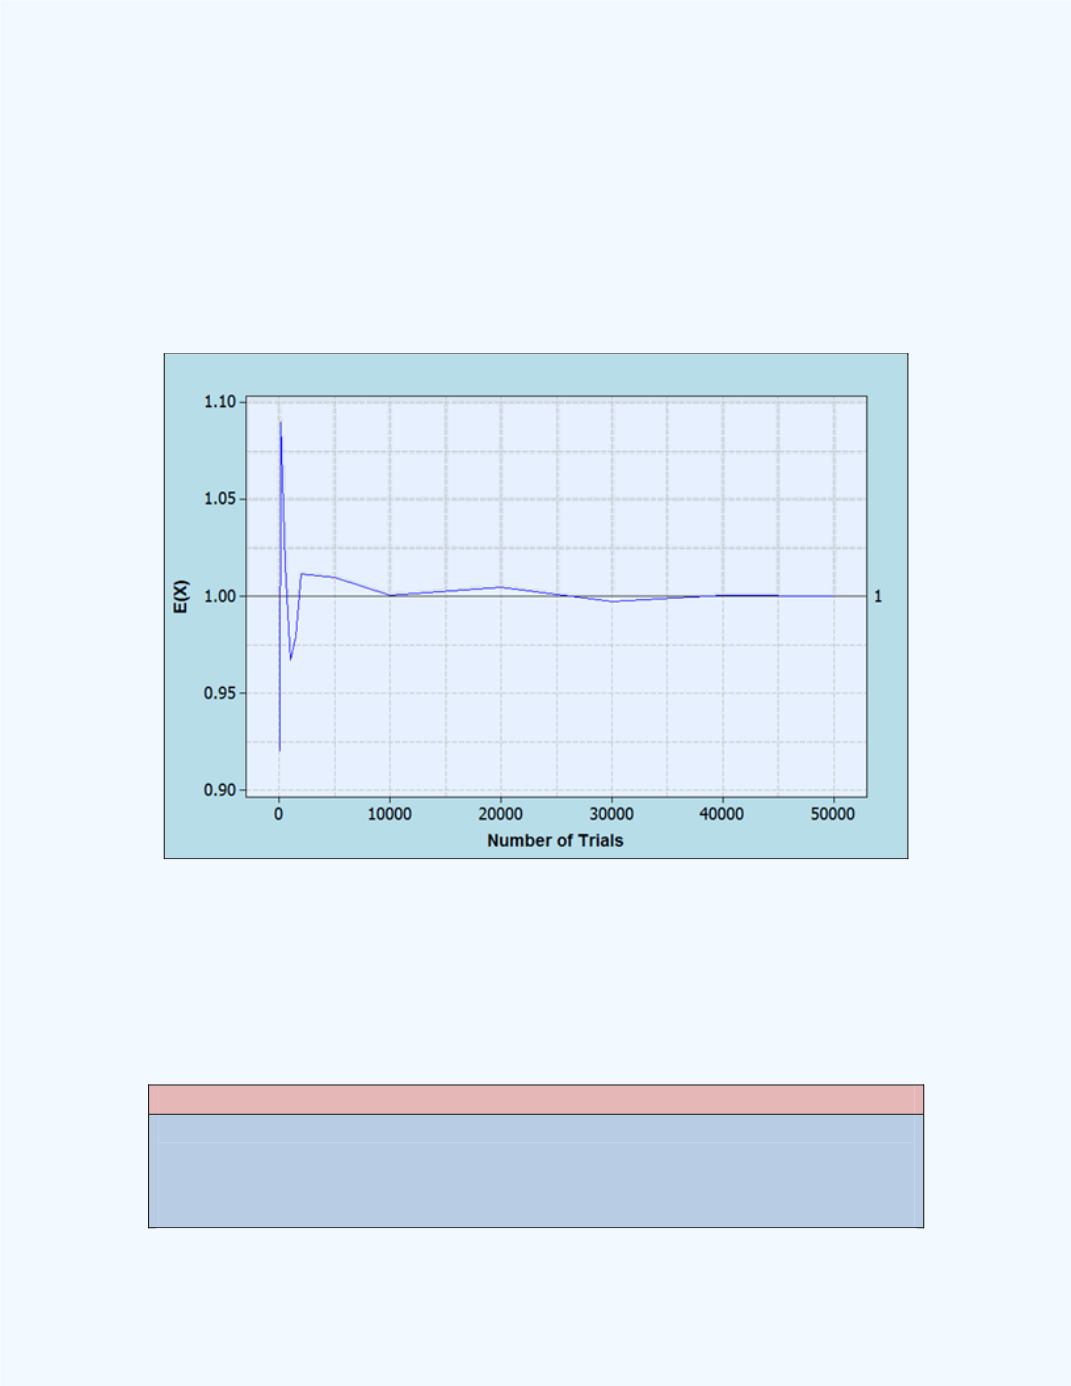
Figure 8-7
shows the result of a simulation for the average values for the
observations generated from the distribution of the number of defective
items in the sample of size two. Observe that as the number of simulation is
increasing, the average value for the samples is fluctuating about the value
of 1. This average or expected value will eventually converge to 1. Recall
that the expected value for the number of defective items in the sample of
size two was 1, so this pattern in the simulation should be expected.
Figure 8-7:
Simulation illustrating the expected number
of defectives in a sample of size two
The expected value for
Example 8-1
was 1 which was also one of the values
for the random variable. However, this is not necessarily the case for all
situations.
Note:
For discrete random variables, the expected value is very seldom one of the
possible outcomes of the random variable.