


 314 / 762

314
Chapter 8: Discrete Probability Distributions
Example 8-1:
Find the expected number of defective items when two
items are selected at random from a manufacturing process.
Solution:
Let the number of defective items in the sample of size two be
represented by the random variable
X
. Using the formula and the
information from the probability distribution in
Table 8-2
, we have
E
(
X
) = 0
0.25 + 1
0.5 + 2
0.25 = 1.
That is, if we select a large number of samples of size two, on average, there
will be one defective item in each of the sample of size two.
Note:
Sometimes, it is convenient to create a table to compute the expected
value for a random variable. Using the information for
Example 8-1
, we can
create the following table to help with the computations as shown in
Table
8-3
.
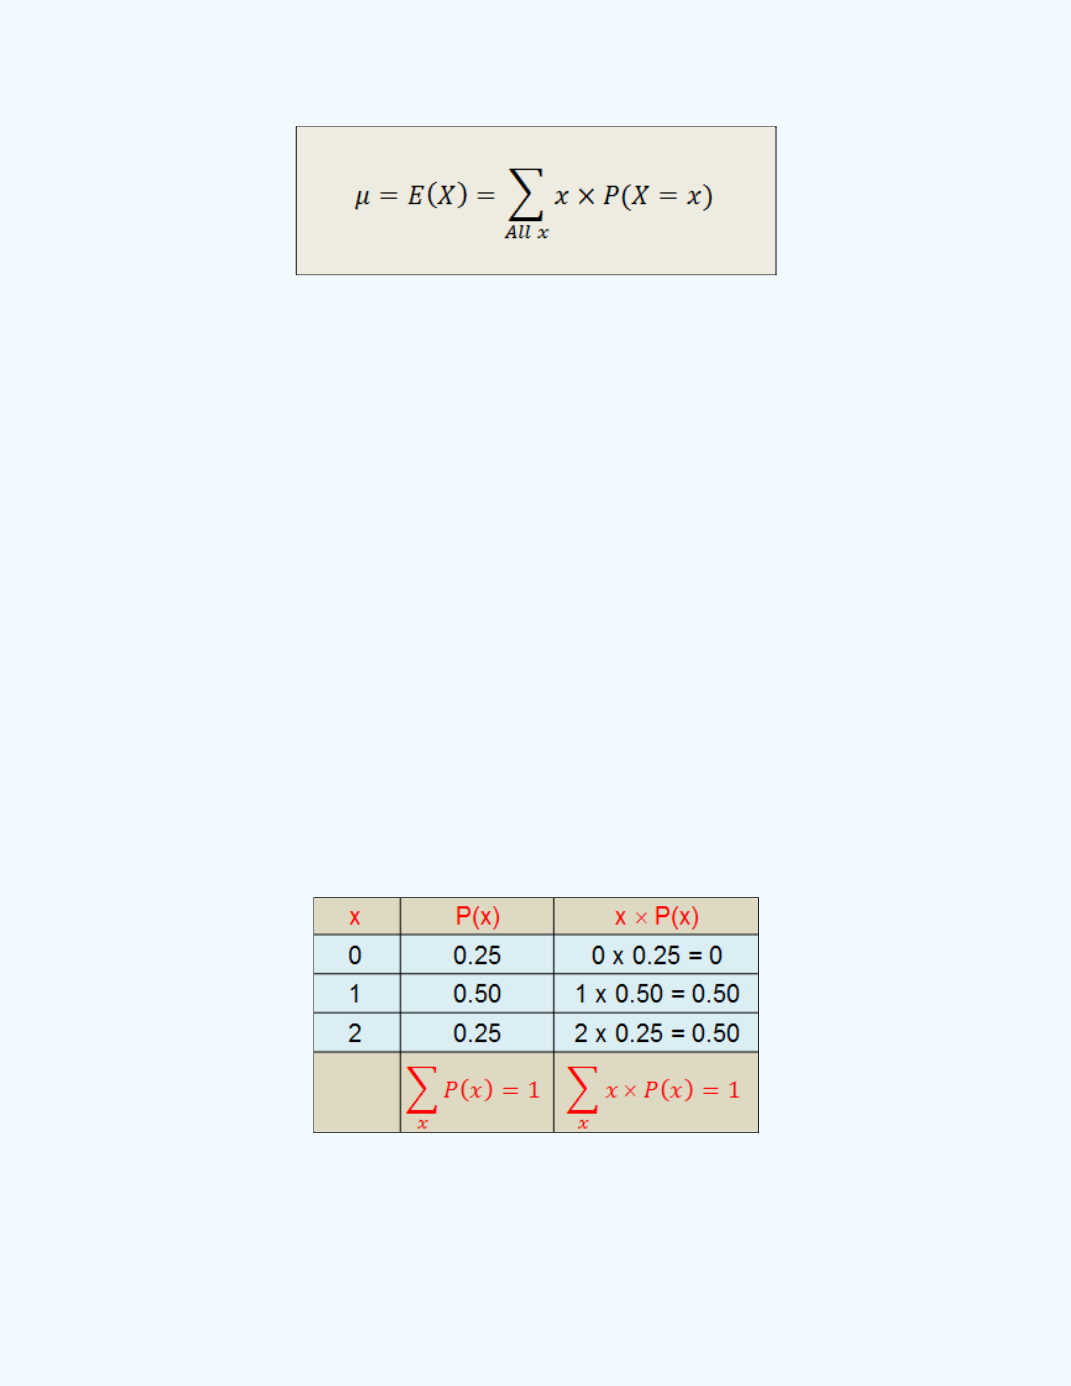
Table 8-3:
Table showing the Probability
Distribution and Expected value computations
for
Example 8-1
From
Table 8-3
, we see that if we sum the values in the third column, we
get the value of the expected value of
X
.