


 312 / 762

312
Chapter 8: Discrete Probability Distributions
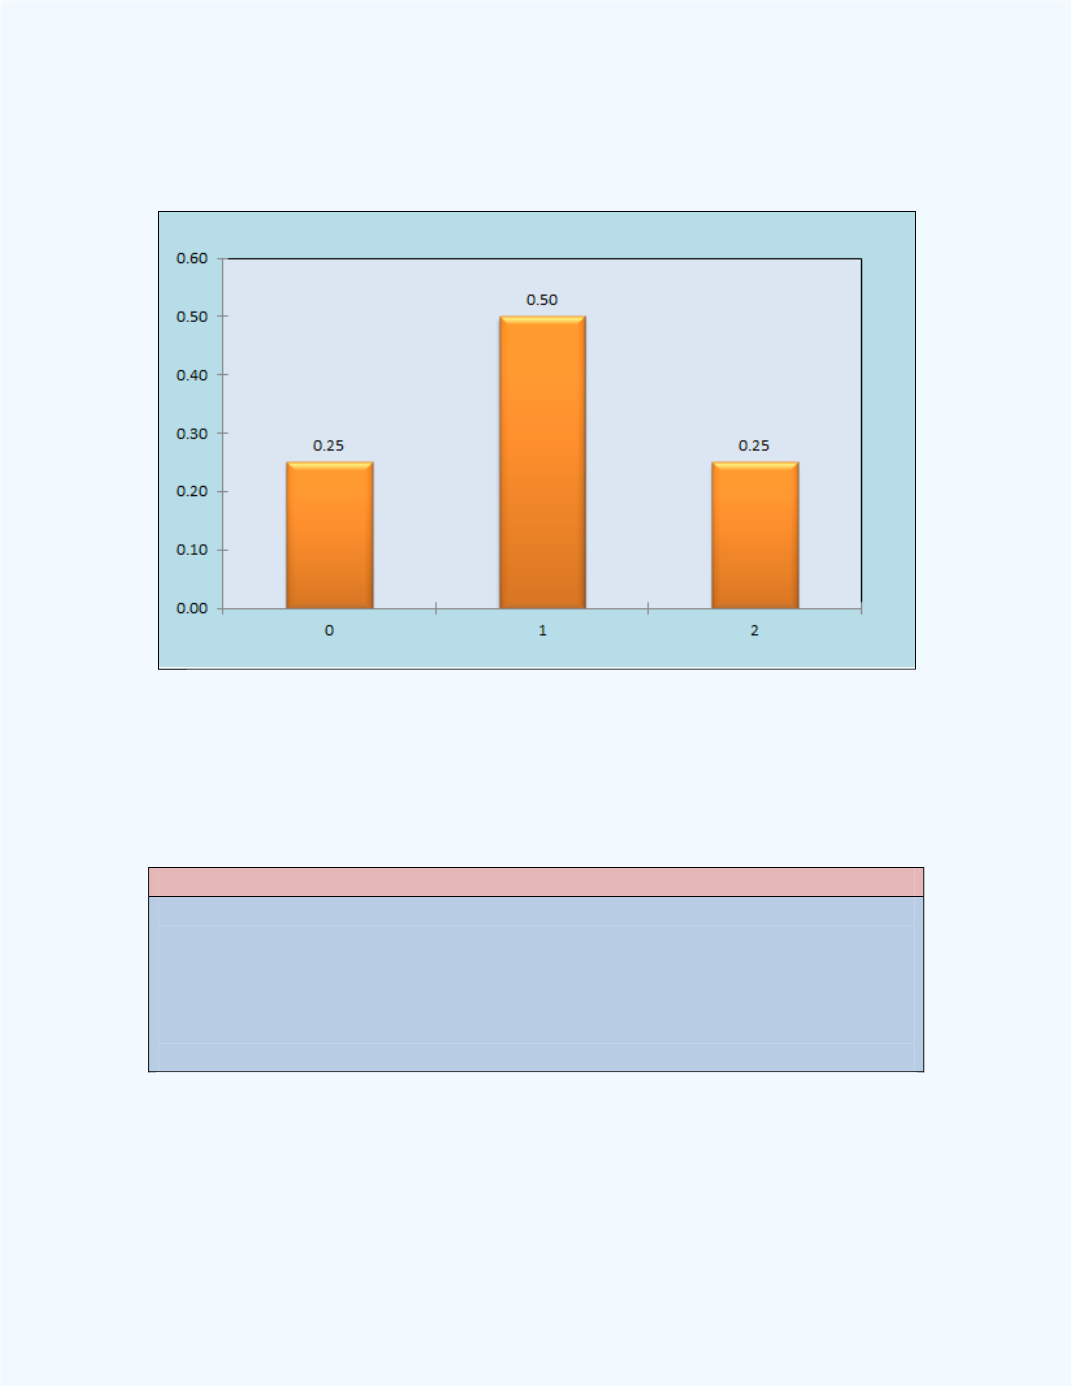
Figure 8-6
shows a bar graph representation of the probability distribution
for the number of defective items in the sample of size two.
Figure 8-6:
Bar graph for the probability distribution for the
number of defective items in the sample of size
two.
Next are listed some properties for a discrete probability distribution.
Notes:
The probability of any value in a discrete probability distribution must
be between 0 and 1, inclusively. That is,
P
(0
X
1).
The sum of all the probabilities in a discrete distribution must equal 1.
That is, ∑{
P
(
X
=
x
)} = 1.