


 311 / 762

Chapter 8: Discrete Probability Distributions
311
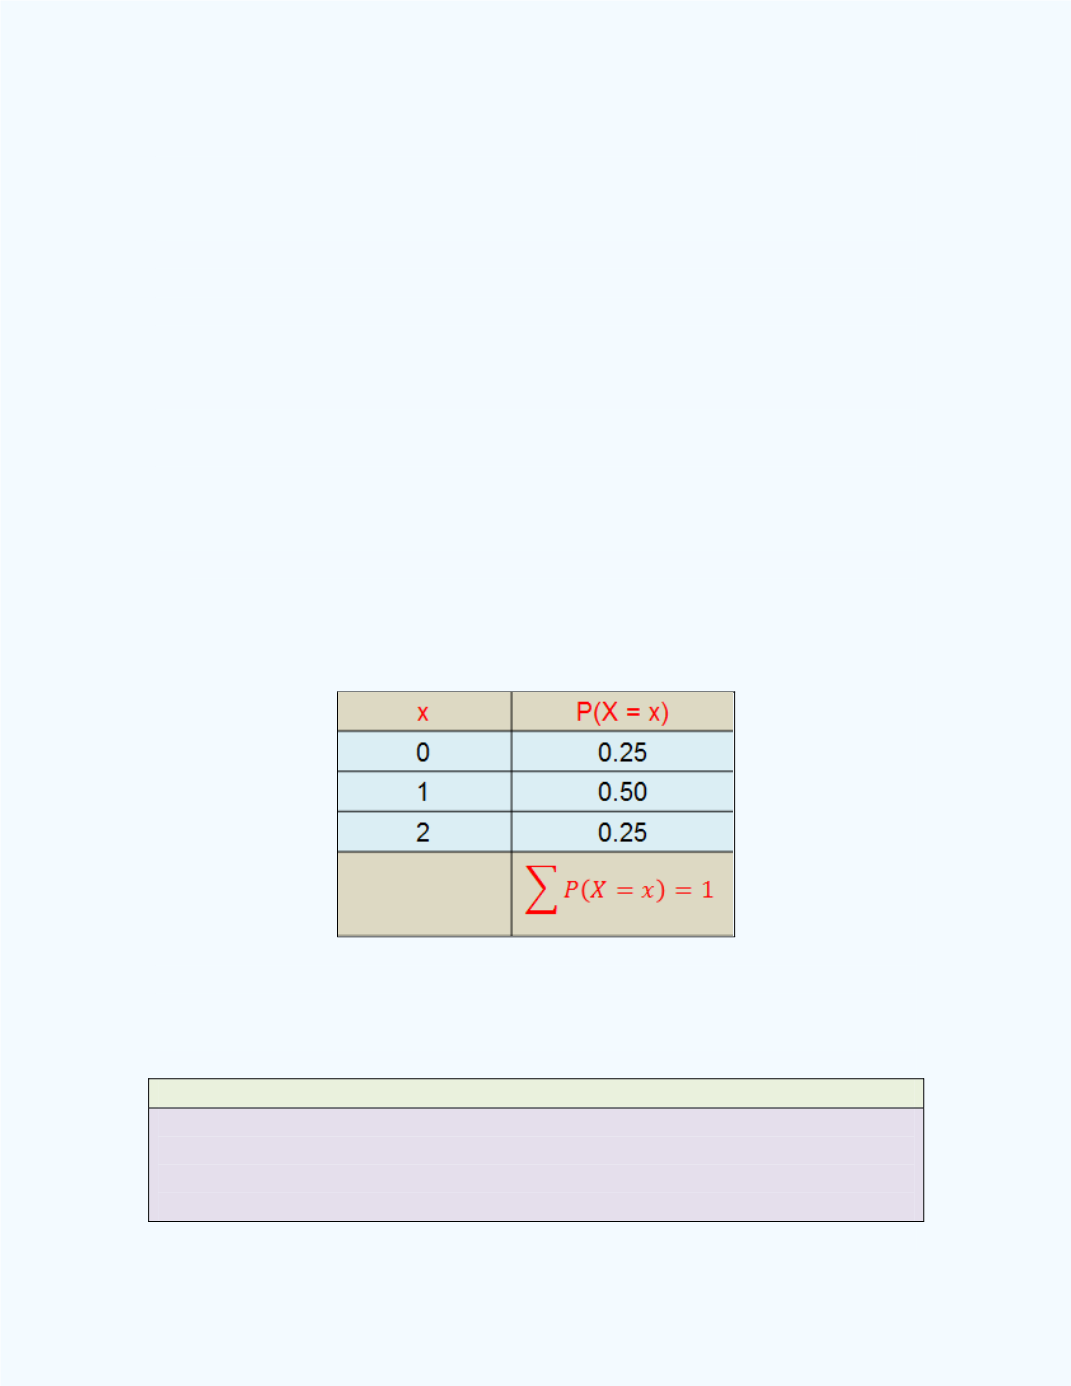
Let the number of defective items in the sample of size 2 be represented by
X
. Then the values for
X
are
x
= 0, 1, 2. Using the classical definition of
probability,
P
(
X
= 0) =
P
(
NN
) = ¼ = 0.25
P
(
X
= 1) =
P
(
DN
or
ND
) =
P
(
DN
) +
P
(
ND
) since the events
DN
and
ND
are
mutually exclusive.
Thus,
P
(
X
= 1) =
P
(
DN
) +
P
(
ND
) = ¼ + ¼ = ½ = 0.5.
P
(
X
= 2) =
P
(
DD
) = ¼ = 0.25.
We can arrange the values of the random variable and the associated
probabilities in tabular form, as shown in
Table 8-2
.
Table 8-2:
Values of X and
Associated Probabilities
for
Illustration1
Such a table is called a
probability distribution
since it displays the values
of the random variable
X
with their associated probabilities. In particular, it
is a
discrete probability distribution
, since the random variable is discrete.
Definition: Discrete Probability Distribution
A discrete probability distribution consists of all possible values of a discrete
random variable with their corresponding probabilities.