


 319 / 762

Chapter 8: Discrete Probability Distributions
319
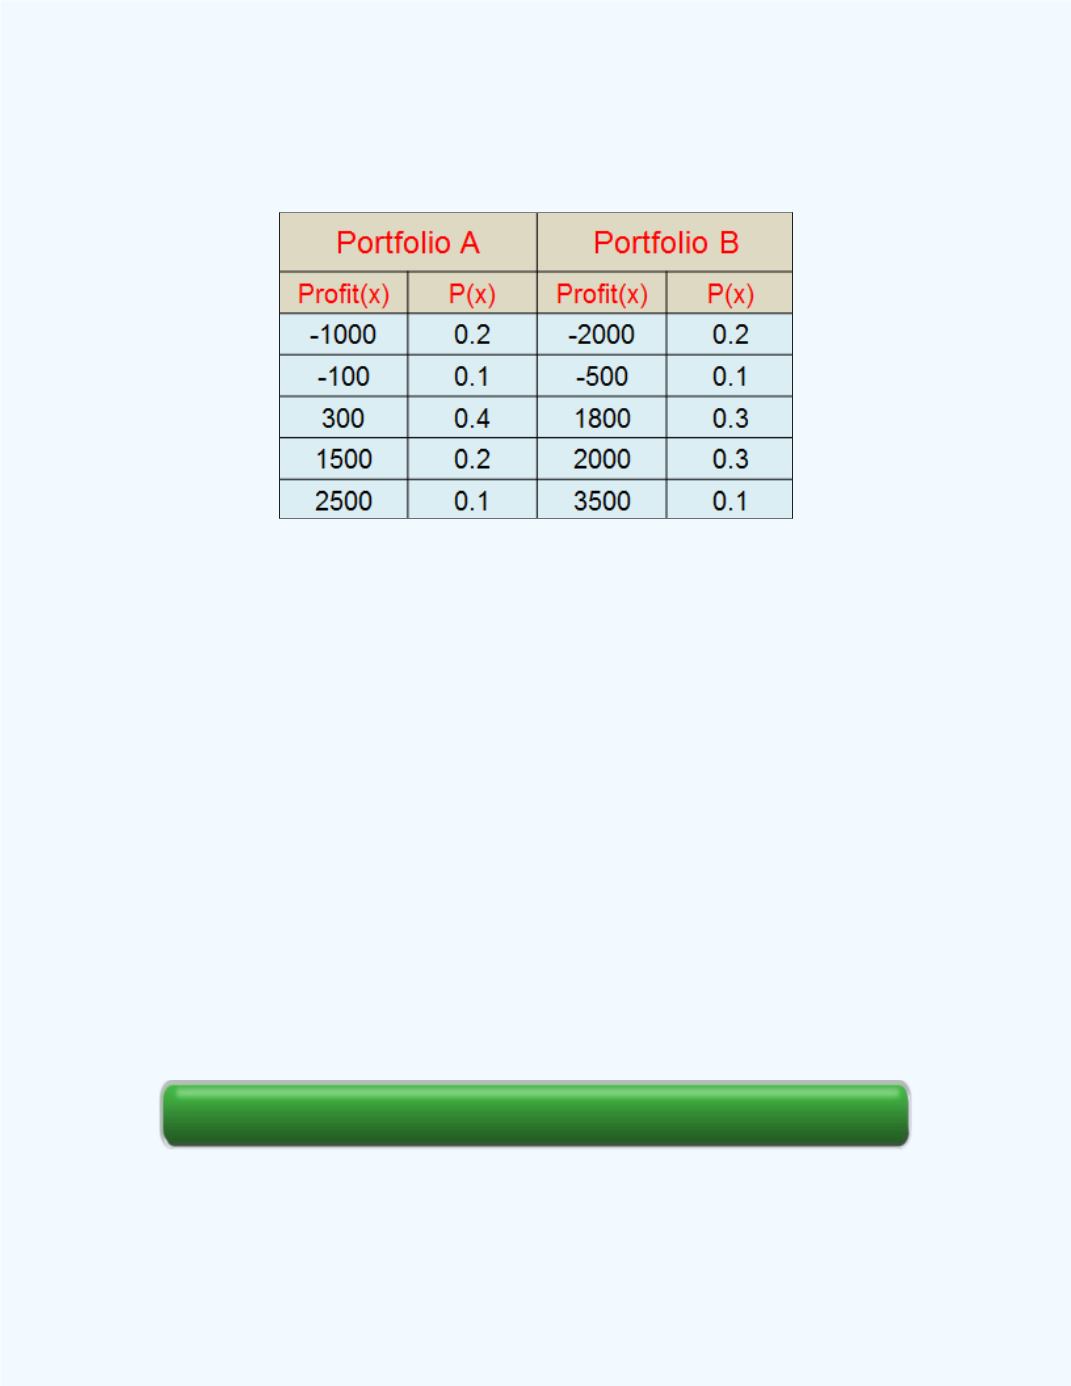
Table 8-8:
Probability Distributions for
Portfolios A and B
Solution:
Let the profit for portfolio A be represented by the random
variable
X
, and let the profit for portfolio B be represented by the random
variable
Y
. Then,
E(X) =
(-1000)
0.2 + (-100)
0.1 + 300
0.4 + 1,500
0.2 + 2,500
0.1
= $460.
E
(
Y
) = (-2,000)
0.2 + (-500)
0.1+ 1,800
0.3 + 2,000
0.3 + 3,500
0.1
= $1040.
Since,
E
(
Y
) >
E
(
X
), you should invest in portfolio B based on the expected
profit. That is, in the long run, portfolio B will out perform portfolio A.
Thus, under repeated investments in portfolio B, you will, on average, gain
$(1,040 – 460) = $580 over portfolio A.
Section Review
e-Self Review