


 503 / 762

Chapter 11: Confidence Intervals – Large Samples
503
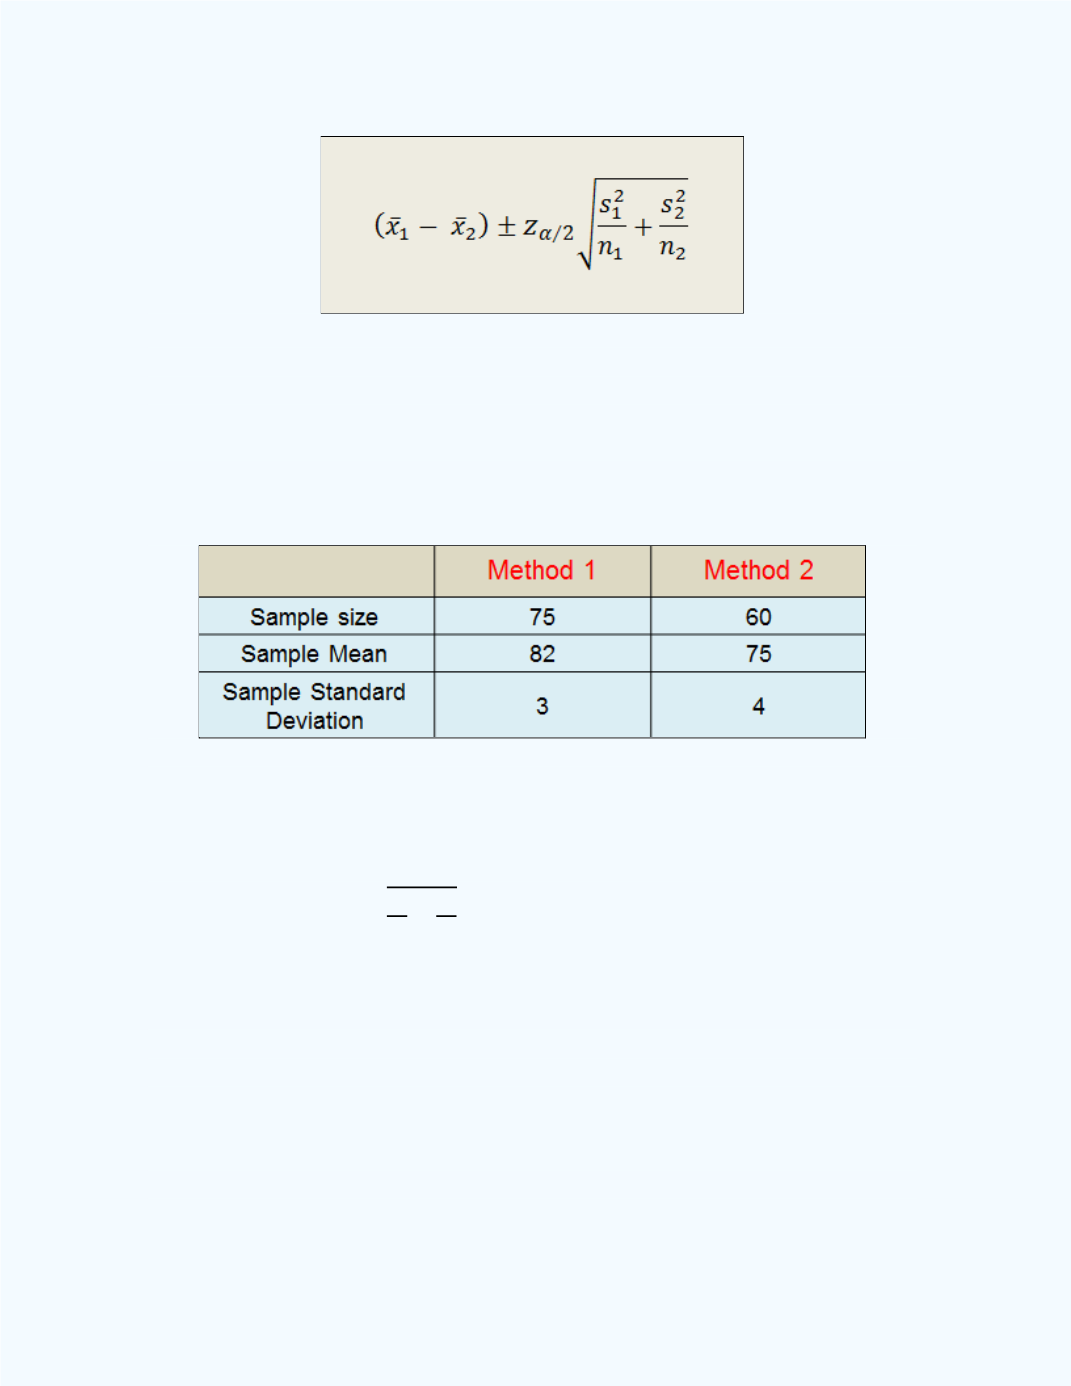
Example 11-14:
Two methods were used to teach a bio-statistics course.
A sample of 75 scores was selected for method 1, and a sample of 60 scores
was selected for method 2. Assume the sampling populations are normally
distributed.
Table 11- 4
shows the results of the study.
Table 11-4:
Information Related to
Example 11-14
Construct a 99% confidence interval for the difference
(Method 1 – Method 2) in the mean scores for the two methods.
Solution:
From the information given, we have
= 75,
= 60,
̅
= 82,
̅
= 75,
= 3,
=4,
√
= 0.621825,
= 0.01,
z
/2
= 2.575829. Thus,
the 99 percent confidence interval estimate for
is (82 - 75)
2.575829
0.621825 = 7
1.6017 (to four decimal places). That is, we are 99
percent confident that the difference between the means will lie between
5.3983 to 8.6017. Since both limits are positive, one may conclude that the
mean score for Method 1 is larger than the mean score for Method 2.
We can also use the
Large Sample Confidence Interval for the Difference
Between Two Population Means
workbook to help with the computations.
Figure 11 – 20
shows the workbook output.