


 506 / 762

506
Chapter 11: Confidence Intervals – Large Samples
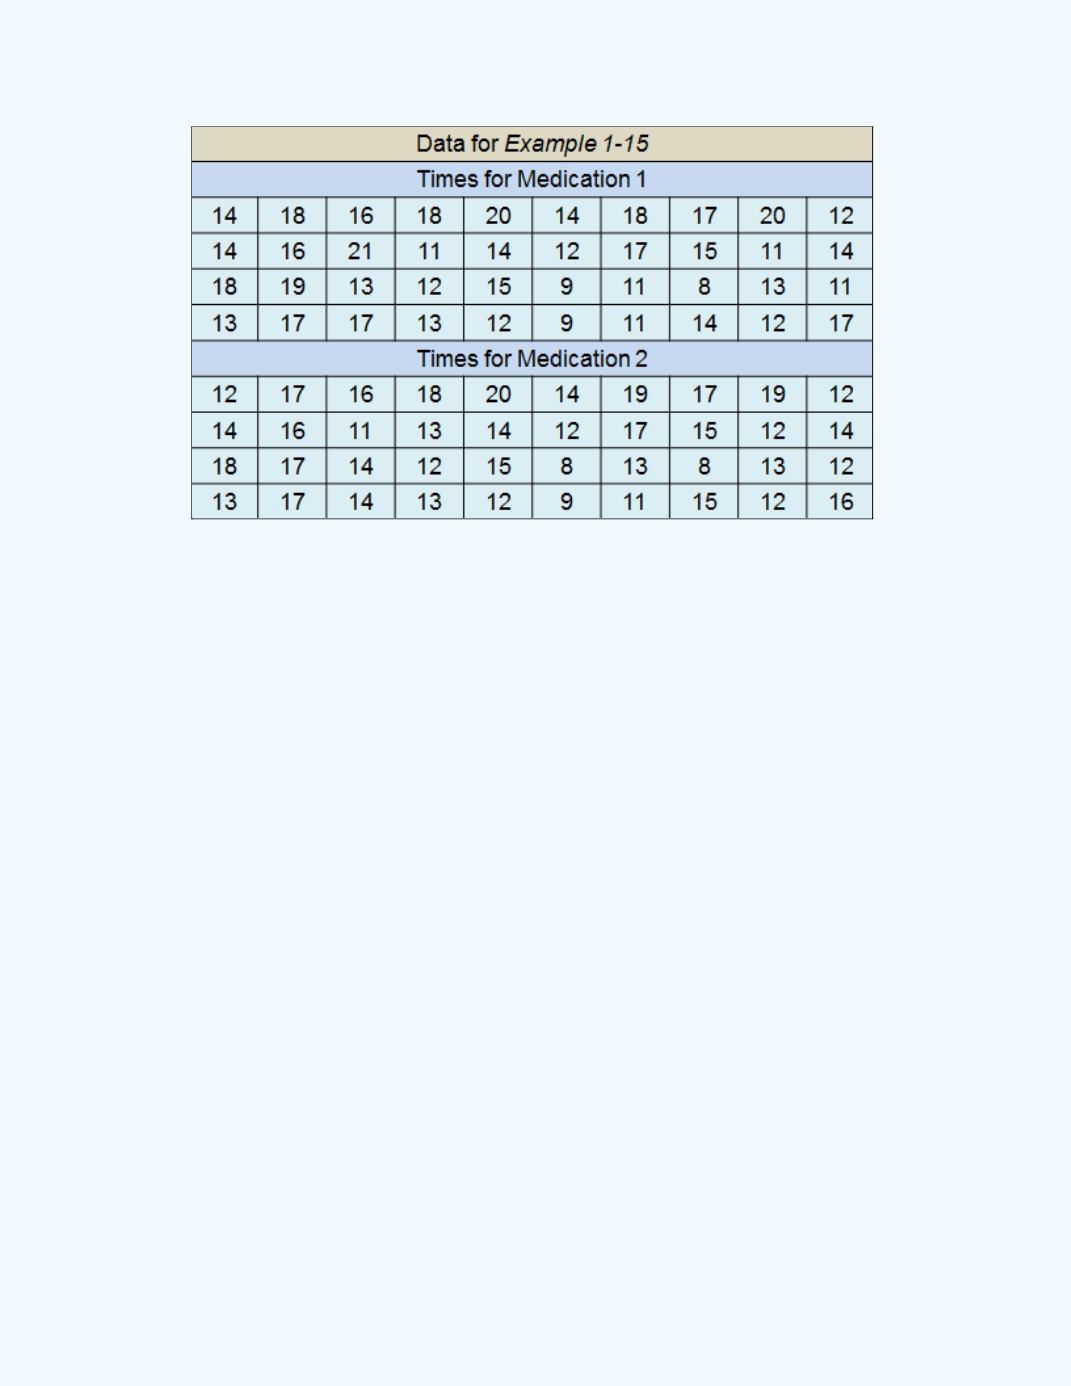
Use the data to construct a 95% confidence interval for the difference
(Times for Medication 1 – Times for Medication 2) in the mean times for the
two medications. Assume that the sampling populations for the two samples
are normally distributed.
We will use the
Large Sample Confidence Interval for the Difference
Between Two Population Means
workbook to help with the computations.
By using this workbook, we will avoid all the computations. Also, we will
enter these values into the portion of the workbook where data are used to
construct the confidence interval. Since the standard deviations for the two
populations of times are unknown, we will have to use the results in that
section
.
Figure 11 – 22
shows the workbook output. Observe that the 95%
confidence interval for the difference of the two population means is -1.0528
to 1.6528. Now, since the interval ranges from a negative value to a positive
value one may conclude that there is not a significant difference between the
average times. That is, both medications seem to have similar effect in
reducing the pain level of the headache and so neither one of them would
have an advantage in reducing the pain level to zero.