


 504 / 762

504
Chapter 11: Confidence Intervals – Large Samples
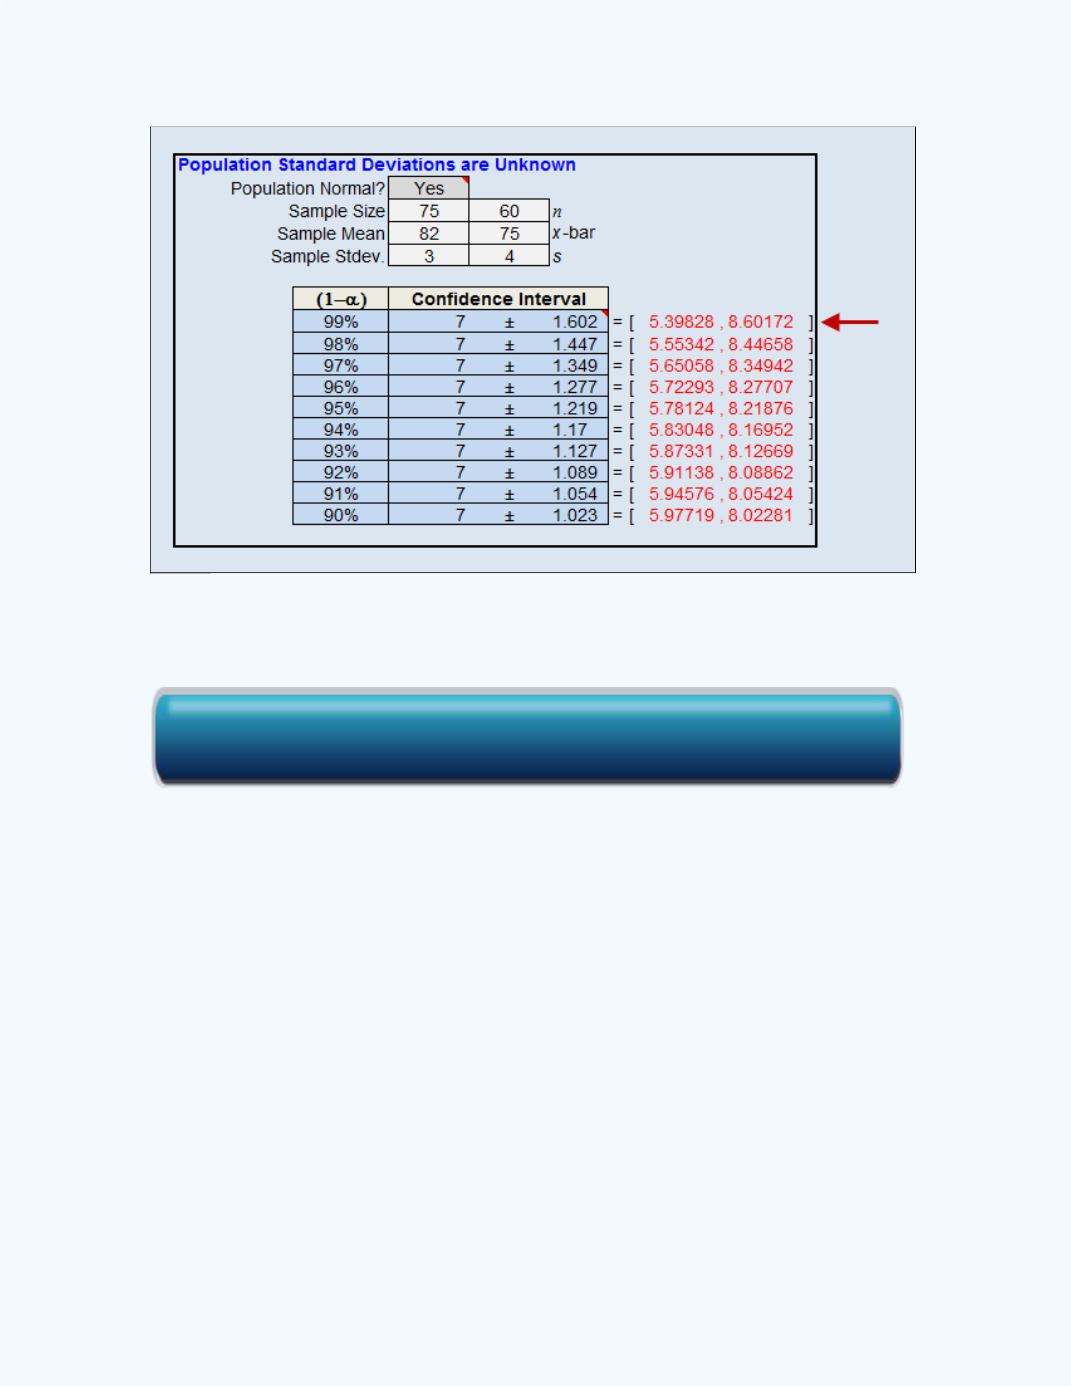
Figure 11- 20:
Workbook Output with the Confidence
Interval for
Example 11-14
The display shows the 99% confidence interval is 5.39828 to 8.60172, the
same as was obtained by using the formula (to four decimal places). The
difference is due to rounding.
Figure 11-21
shows the output with the different confidence intervals for the
differences. Observe that as the level of confidence gets smaller, the width of
the confidence interval also gets smaller.
Click here for the Large Sample Confidence Interval for the Difference Between Two Population Means Workbook