


 702 / 762

702
Chapter 15: Chi-Square Tests
Based on these observations, test at the 5 percent significance level whether
there are significant discrepancies for the distribution of the proportions of
the leading digits for the reported total salaries for the parents when
compared to the proportions specified by Benford’s Law.
Solution:
The objective here is to statistically determine whether these
distributions are significantly different from each other. That is, we need to
check on the goodness-of-fit of the distribution of the proportions of the
leading digits for the salaries of the parents with respect to the proportions
specified by Benford’s Law.
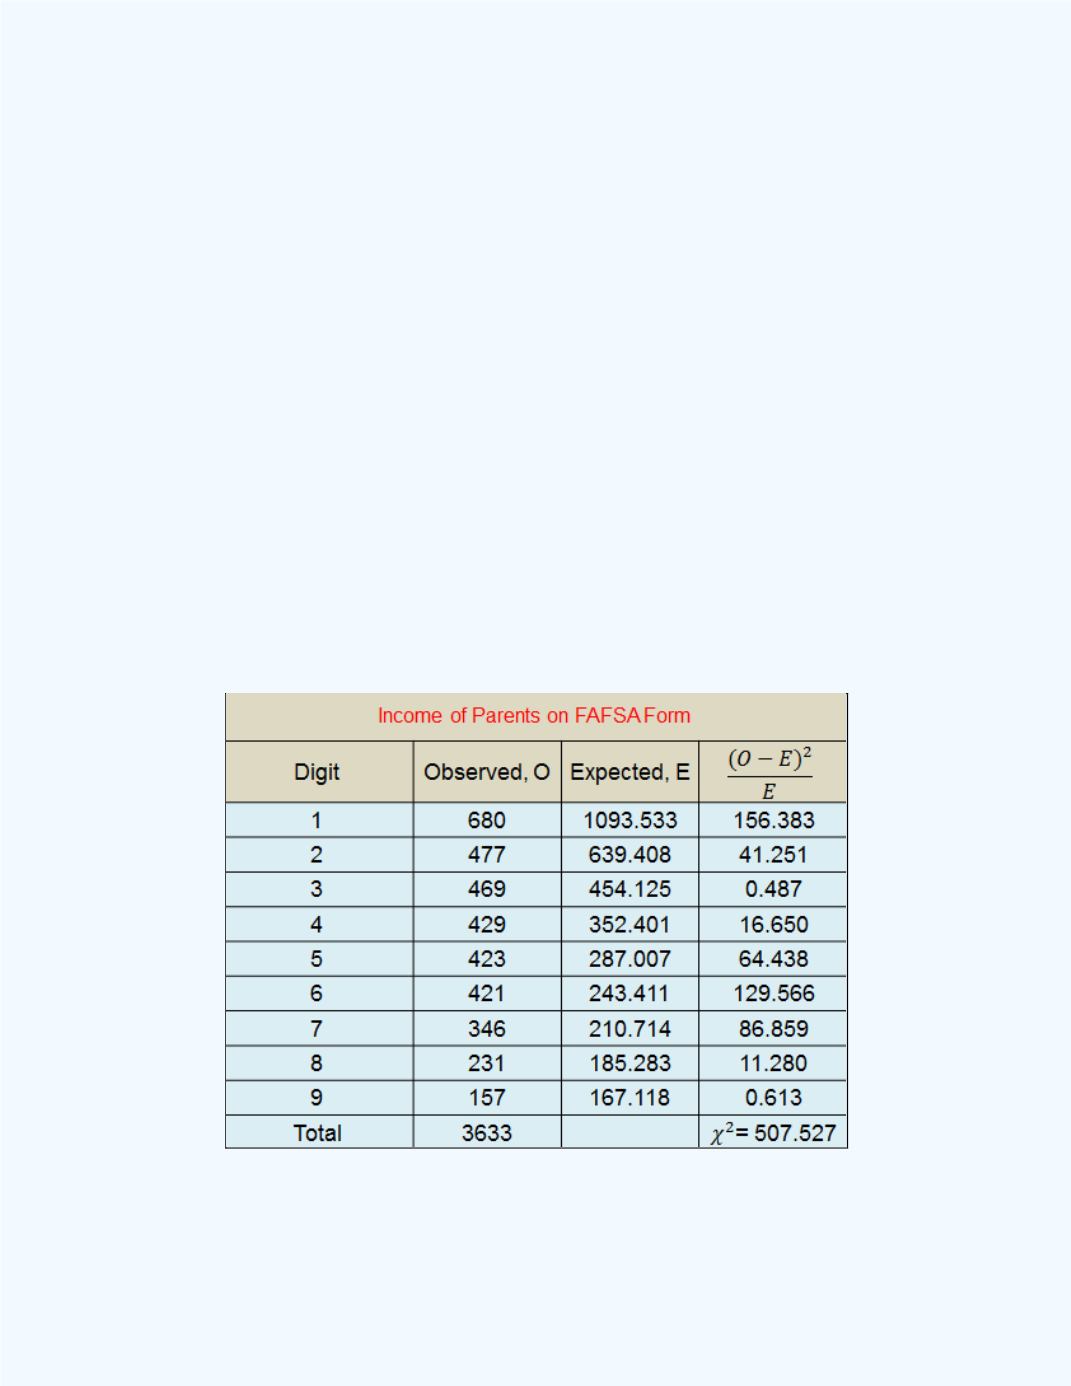
Table 15-16
shows the computations needed to compute the
test statistic.
The value of the test statistic is equal to 507.527. To obtain the expected
frequencies based on Benford’s Law one should multiply the total of 3,633
by Benford’s proportions. For example, from the table, the expected
frequency value of 639.408 is obtained from 3,633×0.176 = 639.408, etc.
Table 15-16:
Table with Computations to Obtain the Test
Statistic Value
= 507.527
We can verify the value for the test statistic by using the
Chi-Square Test
for Goodness-of-Fit
workbook.
Figure 15-33
shows the output from the