


 701 / 762

Chapter 15: Chi-Square Tests
701
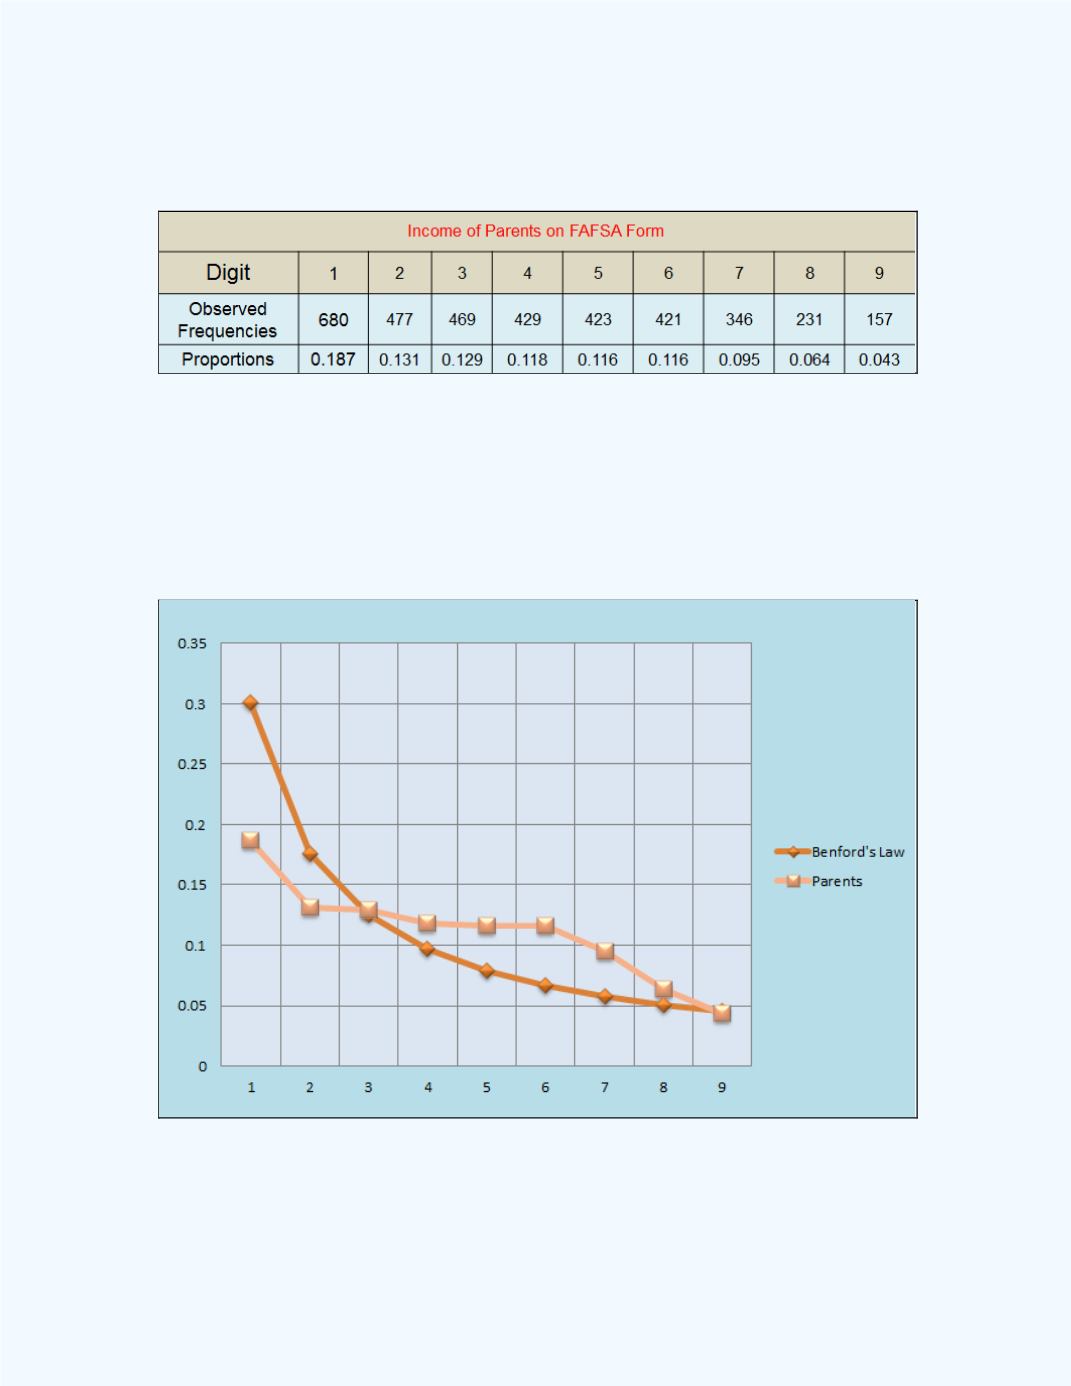
Table 15-15:
Distribution of Leading Digits for reported total
incomes for parents on the FAFSA form
Plots of the proportions of the leading digits for bothBenford’s Law and the
reported salaries for the parents are shown in
Figure 15-32
. Onemay
observe that there seem to be consistent deviations between the distribution
of the proportions for the leading digits of the reported salaries and the
distribution displayed by Benford’s Law except for two or three of the
leading digits.
Figure 15-32:
Plot of Proportions of the Leading Digits for
Benford’s Law and the Salaries for the
Parents