


 696 / 762

696
Chapter 15: Chi-Square Tests
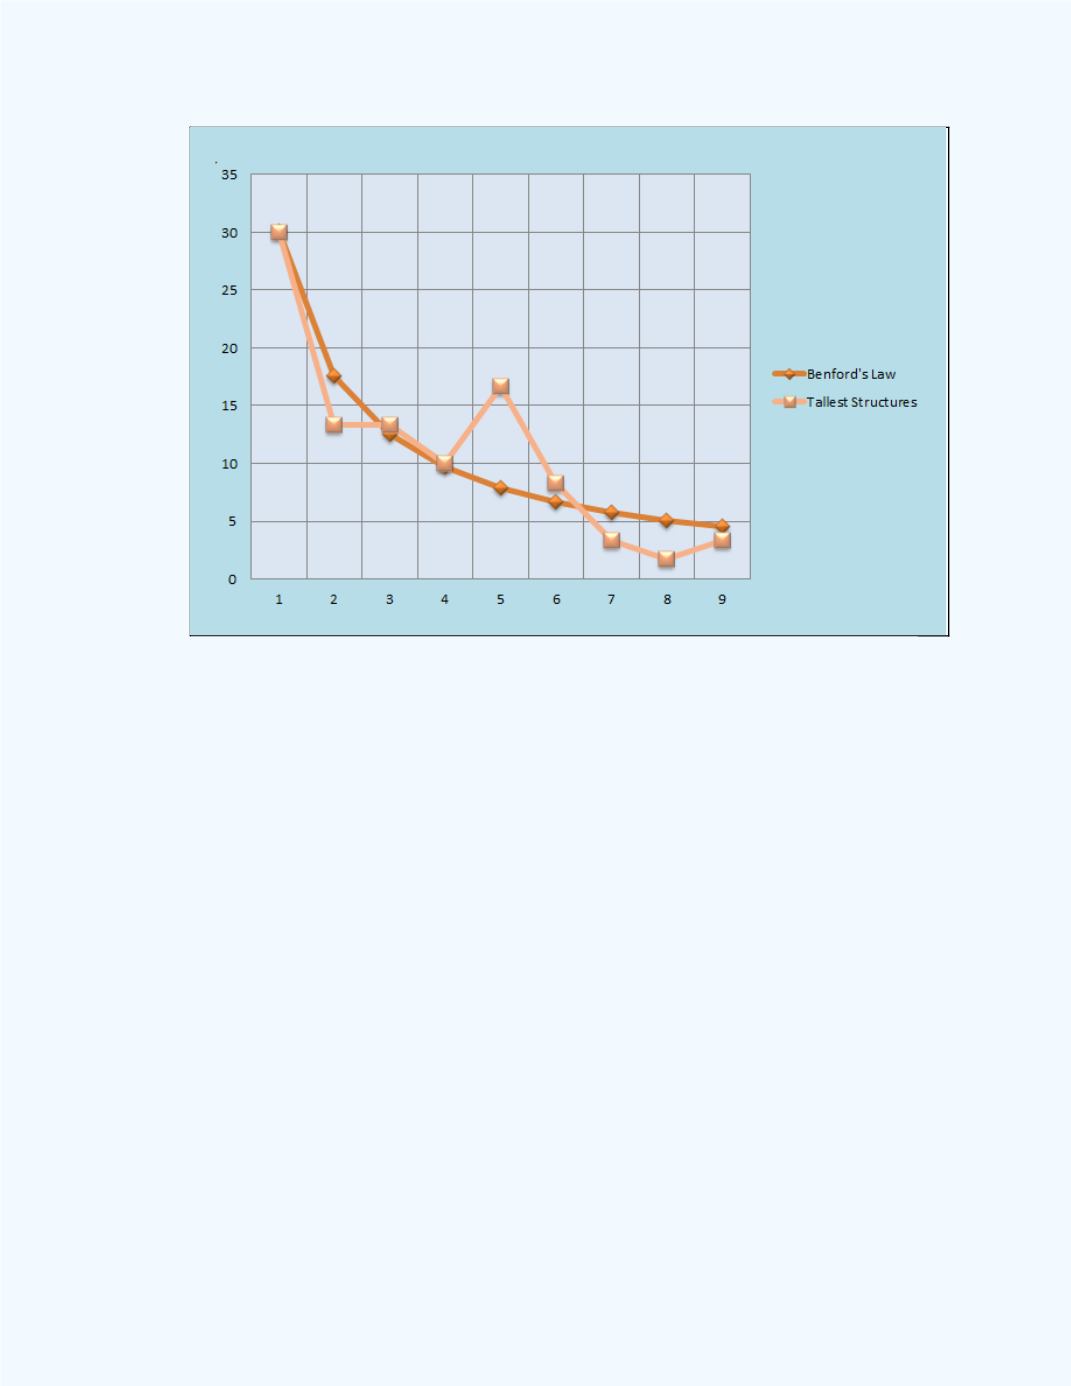
Figure 15-29:
Plots of the Percentages of the leading digits
for the Tallest Structures and those following
Benford’s Law
Since we cannot say for certain whether the observed deviations from
Benford’s Law are significant, we may want to perform a goodness-of-fit
hypothesis test to establish whether this is so or not.
Test at the 0.05 (5%) significance level whether the distribution of the
leading digits for the heights of the tallest structures in the world follow
Benford’s Law.
Solution:
Here we need to check on the goodness-of-fit of the distribution
of the percentages of the leading digits for the heights of the tallest structures
with respect to the percentages specified by Benford’s Law
Table 15-12
shows the values of the observed frequencies and the expected
frequencies. To obtain the expected frequencies based on Benford’s Law
one should multiply the total of 60 by Benford’s proportions. That is, we
will have to use the decimal equivalent of the Benford’s percentages to help