


 699 / 762

Chapter 15: Chi-Square Tests
699
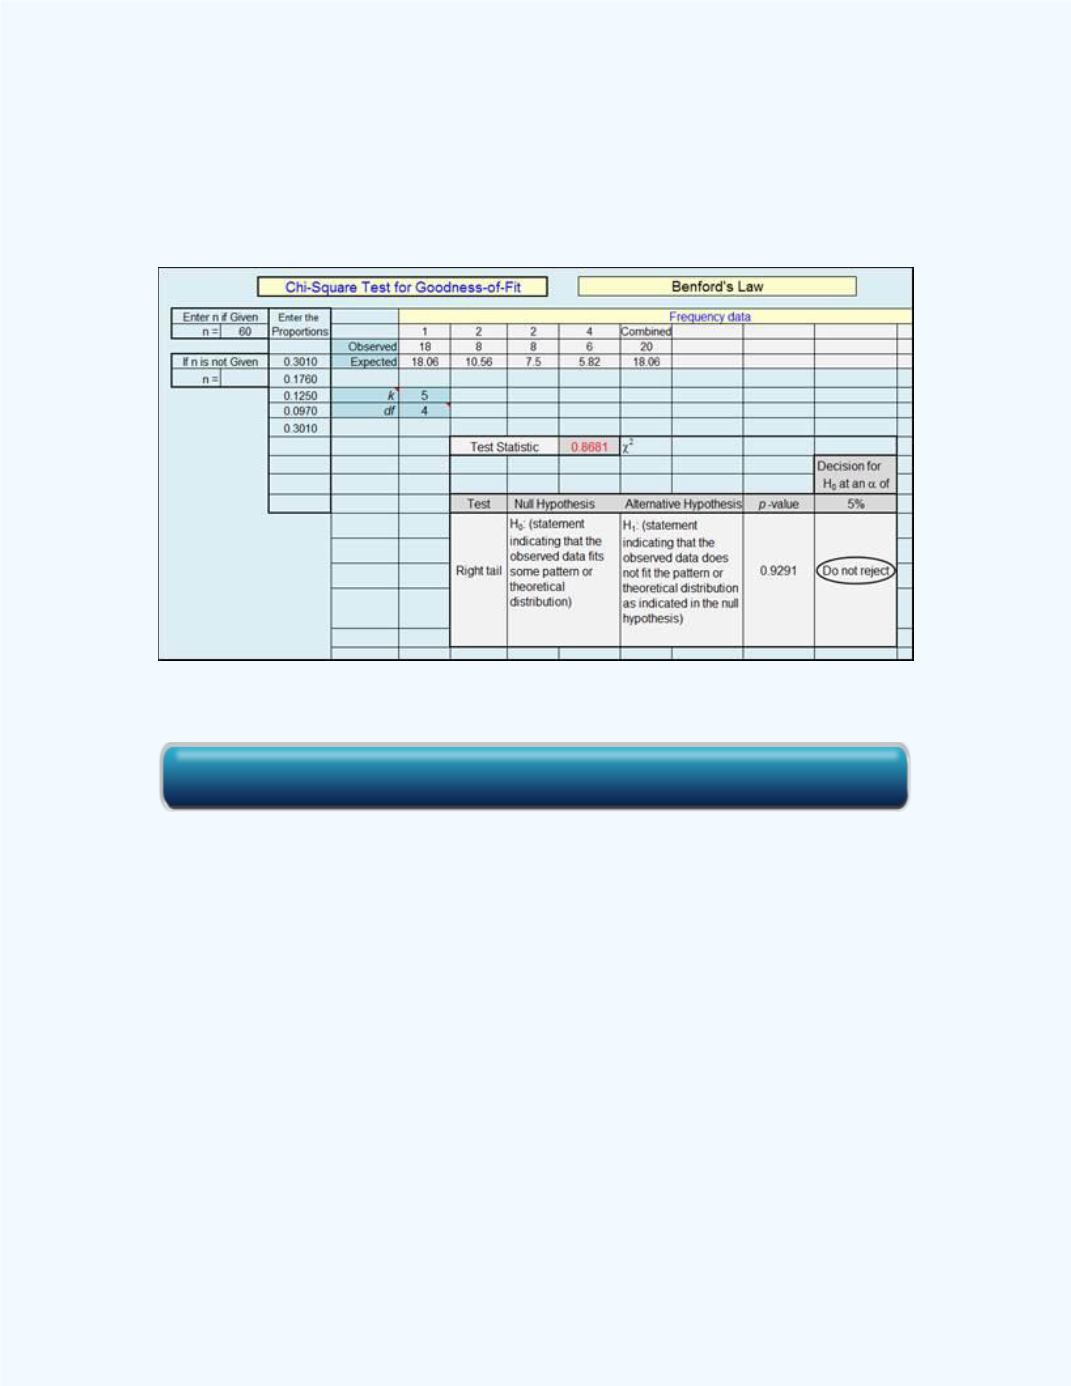
Figure 15-30
shows the output from the
Chi-Square Test for Goodness-of-
Fit
workbook. Observe that the test statistic is 0.8681 with a
P
-value =
0.9291. This
P
-value supports the decision of not rejecting the null
hypothesis since its value is greater than the significance level of 0.05.
Figure 15-30:
Workbook computations for
Example 15-7
Figure 15-31
displays the rejection region. Observe that the test statistic
value is way to the left in the do not reject region. This supports the
decision in the hypothesis test and would suggest that it is very likely that
the distribution of the first digits for the heights of the tallest buildings
will follow Benford’s Law.
Click here for the Chi-Square Test for Goodness-of-Fit Workbook