


 697 / 762

Chapter 15: Chi-Square Tests
697
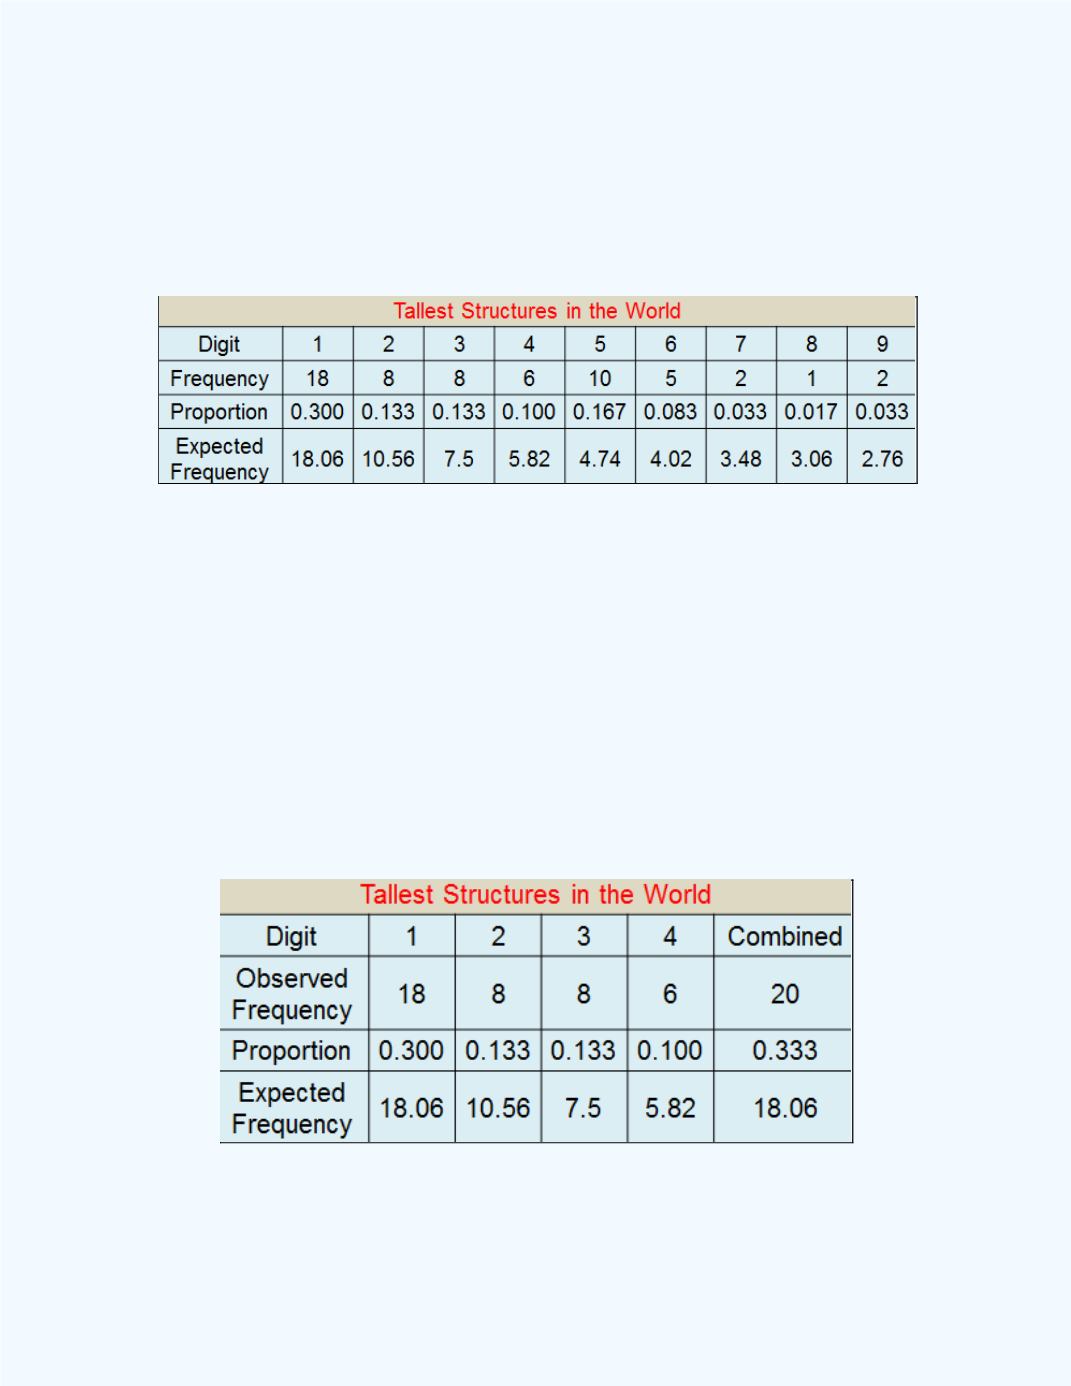
compute the expected frequencies. For example, from the table the
expected frequency value of 10.56 is obtained from 60×0.176 = 10.56, etc.
Table 15-12:
Table with Observed Frequencies and Expected
Frequencies
Observe in
Table 15-12
that several of the expected frequencies are smaller
than the value of 5. Recall in one of the
Notes
in
Section15-2
addressed
such situations. The note indicated that one could combine these categories
such that the expected frequency for this combined category is at least 5. As
such, we will combine the categories with the leading digits of 5, 6, 7, 8, and
9 into a combined category. Note the combined frequency count will be
10 + 5 + 2 + 1 + 2 = 20 and the combined expected frequency count will be
4.74 + 4.02 + 3.48 + 3.06 + 2.76 = 18.06.
Table 15-13
shows the new table
with the combined category.
Table 15-13:
Table with Observed and Expected
Frequencies with the Combined Category
Table 15-14
shows the computations needed to compute the
test statistic.