


 694 / 762

694
Chapter 15: Chi-Square Tests
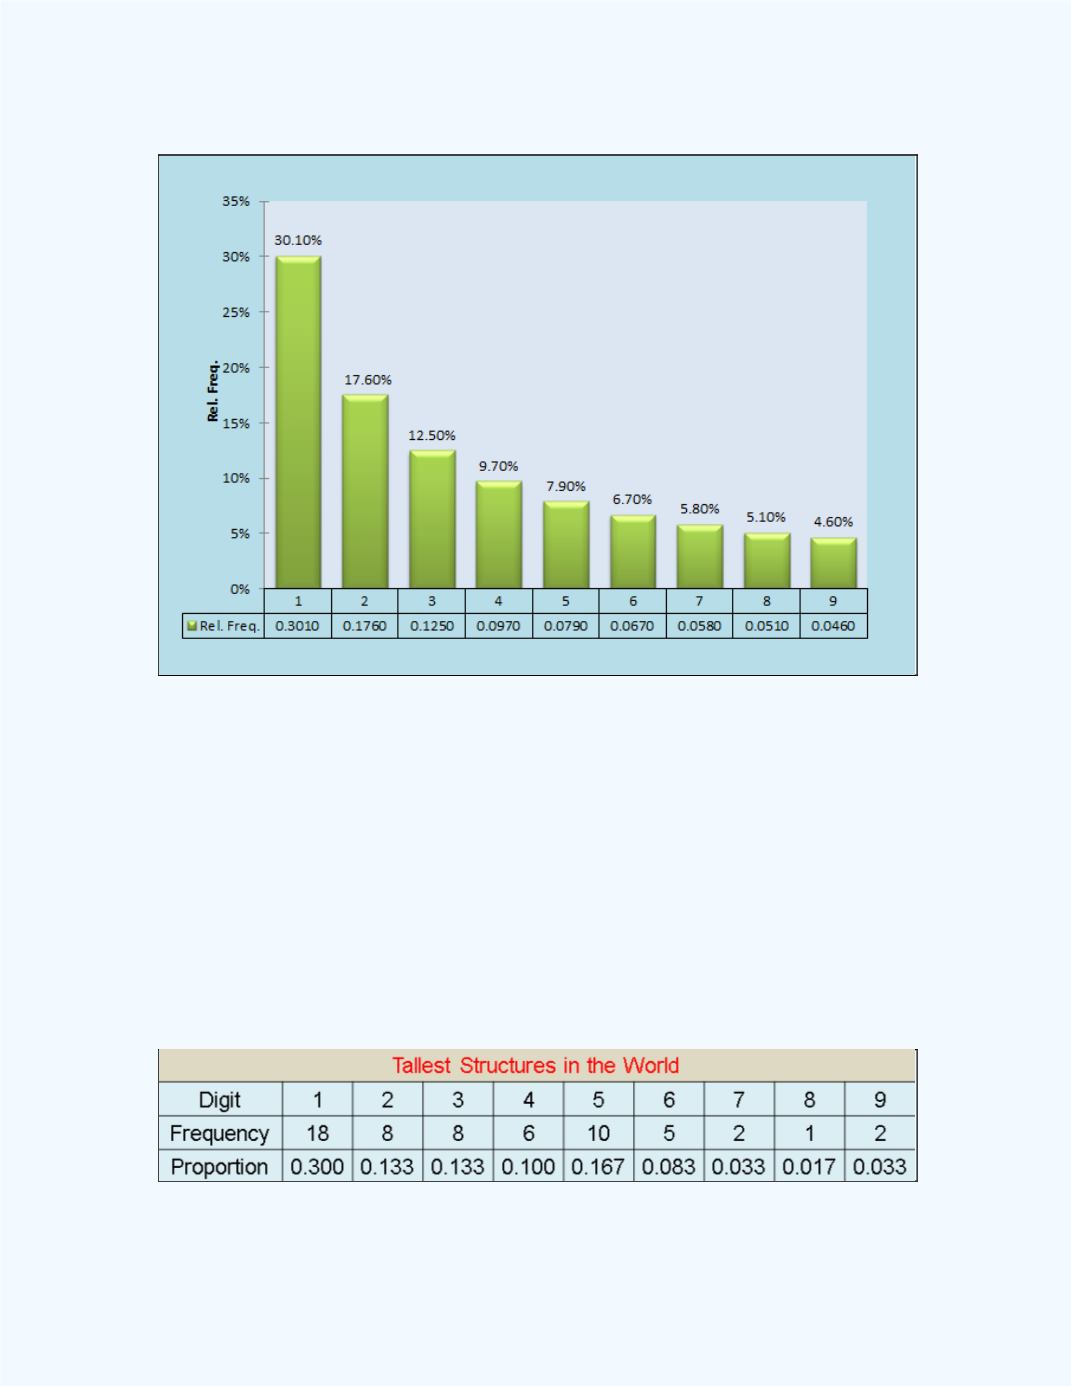
Figure 15-27:
Bar Chart depicting Benford’s Law
Following are a couple of examples which will try to establish whether the
distribution of observed leading digits for the data sets follow Benford’s
Law.
Example 15-7:
Table 15-11
summarizes the leading digits for the heights
in feet for the 60 tallest structures in the world. It gives the observed
frequency counts and the proportions of the leading digits of the heights.
Table 15-11:
Distribution of Leading Digits for Tallest Structures