


 288 / 762

288
Chapter 7: Probability
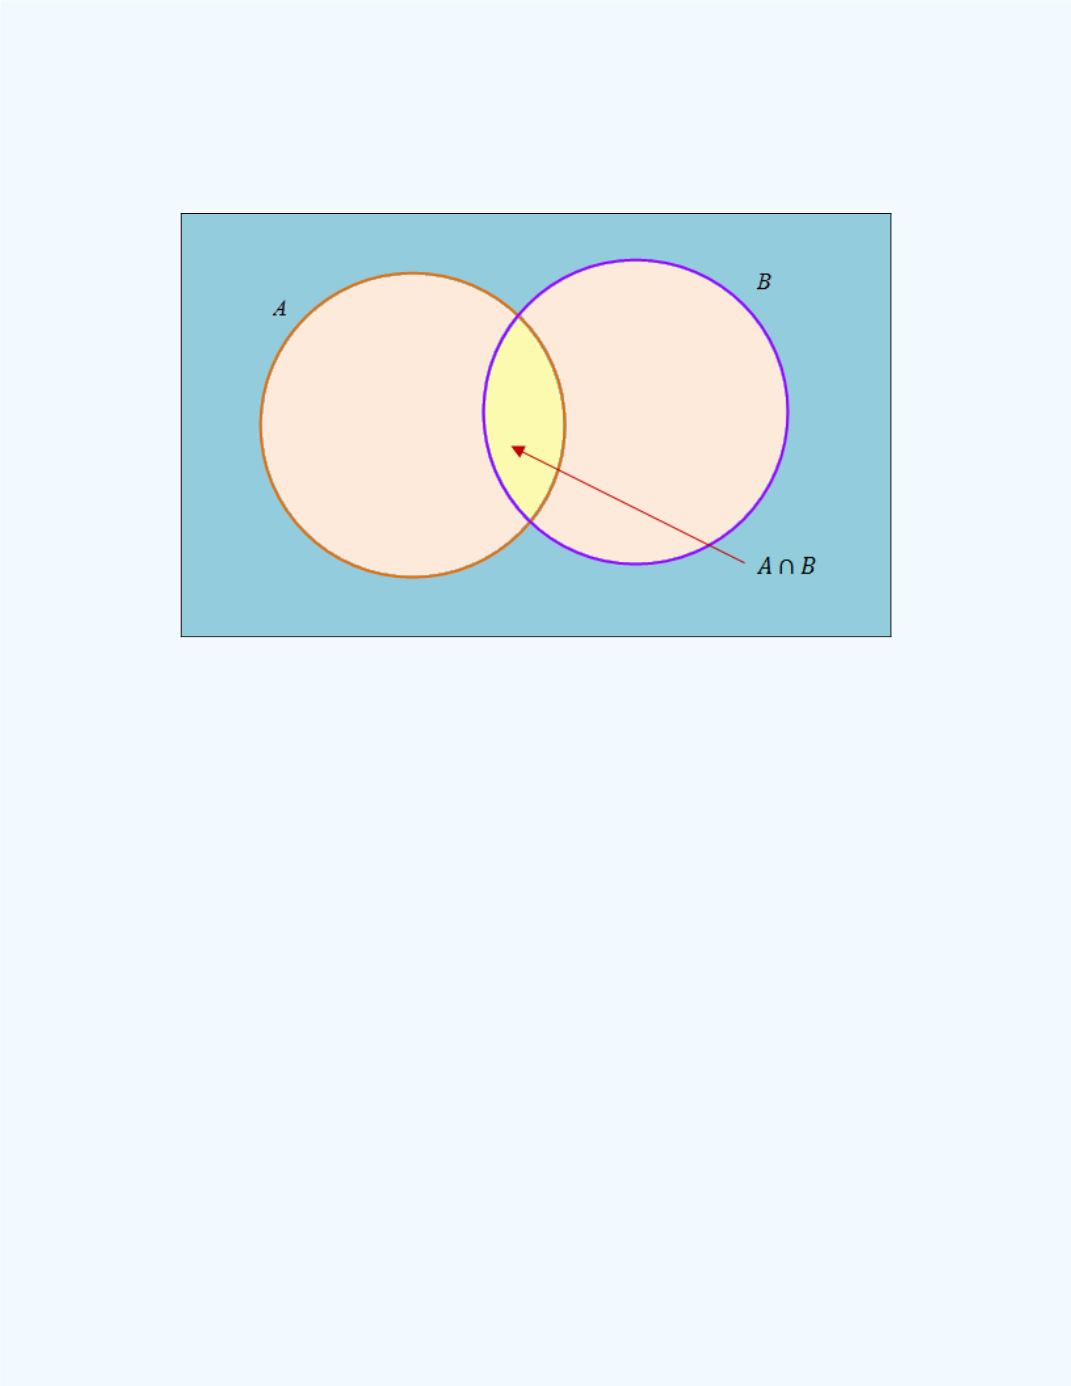
The Venn diagram given in
Figure 7-11
depicts the intersection of events
A
and
B
. The shaded area represents the event of
A
B
.
Figure 7-11
: Venn diagram for
A
B
or (A and B)
(Shaded yellow area)
Example 7-14:
Let
A
be the event of rolling a fair six-sided die. Let
B
be
the event of an even number between 0 and 9. What is
A
B
?
Solution:
Recall that
A
= {1, 2, 3, 4, 5, 6} and
B
= {2, 4, 6, 8}. Thus,
A
B
= {2, 4, 6,}. The event of
A
B
is shown in
Figure 7-12
for
Example 7-14
.