


 289 / 762

Chapter 7: Probability
289
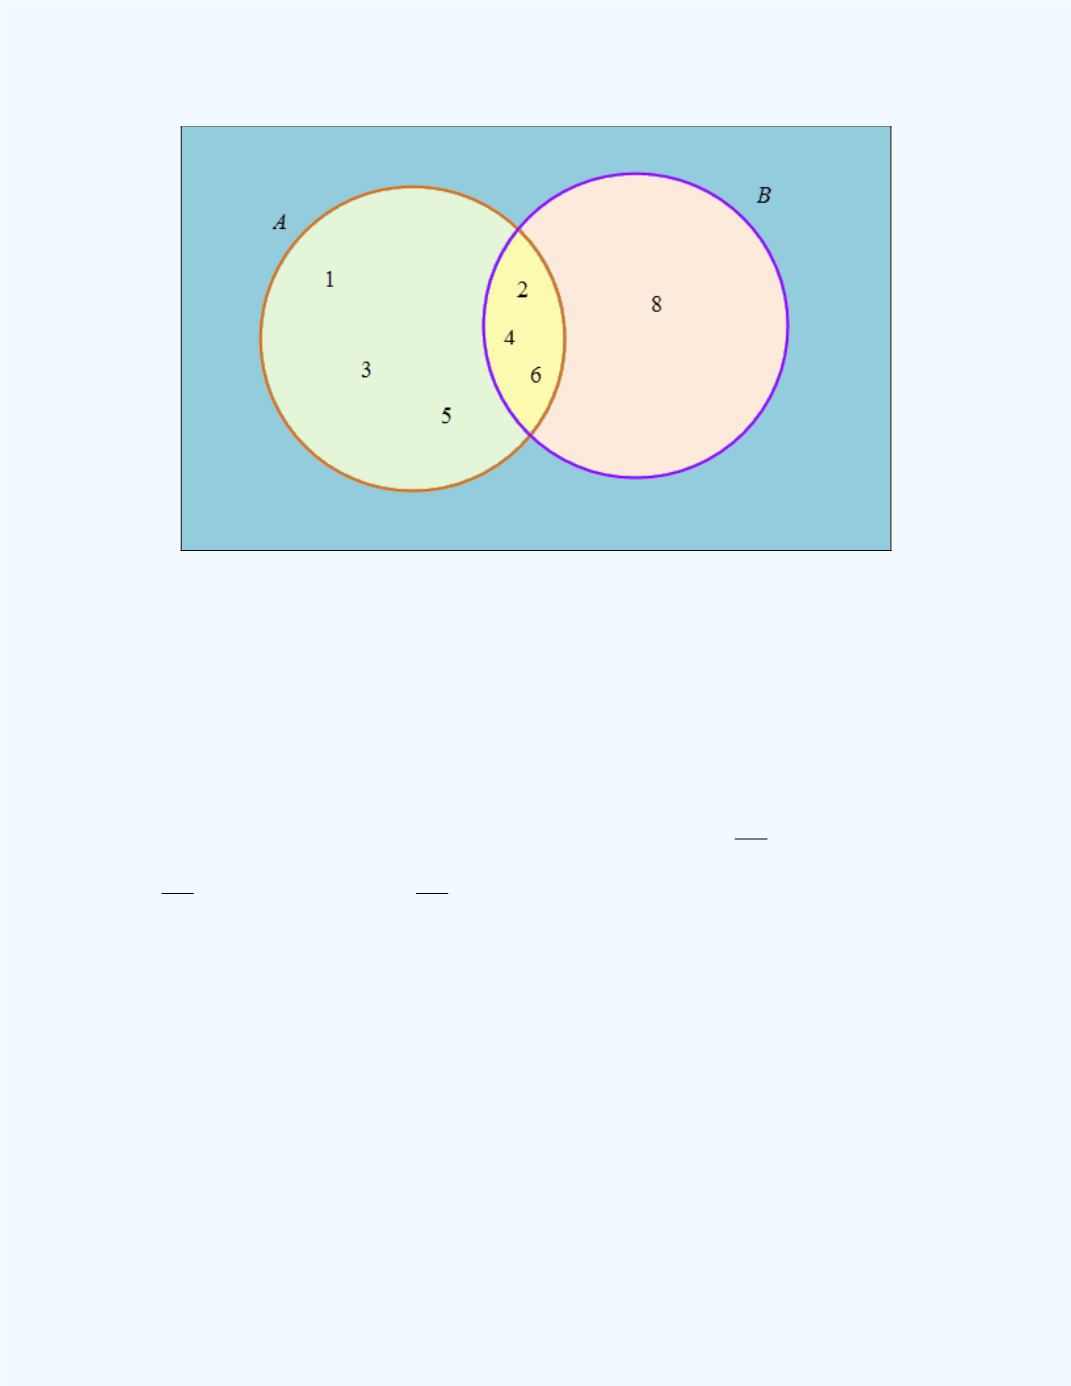
Figure 7-12
: Venn diagram for
Example 7-14
Example 7-15:
In a sample of 100 college students, 60 said they own a 4G
smart phone, 30 said they own an i-Pad, and 10 said they own both a 4G
smart phone and an i-Pad. Compute probabilities for these events and depict
this information on a Venn diagram.
Solution:
Let
A
be the event that a student owns a 4G smart phone, and let
B
be the event that a student owns an i-Pad. Thus,
P
(
A
) =
,6.0
100
60
P
(
B
) =
3.0
100
30
, and
P
(
A
B
) =
1.0
100
10
. Thus, the probability of
only
A
occurring is 0.6 – 0.1 = 0.5, and the probability of
only
B
occurring is
0.3 – 0.1 = 0.2. Note that we have to subtract the portion that is common to
both
A
and
B
in order to get
only A
and
only B
. This information is depicted
in
Figure 7-13
.