


 360 / 762

360
Chapter 9: The Normal Probability Distribution
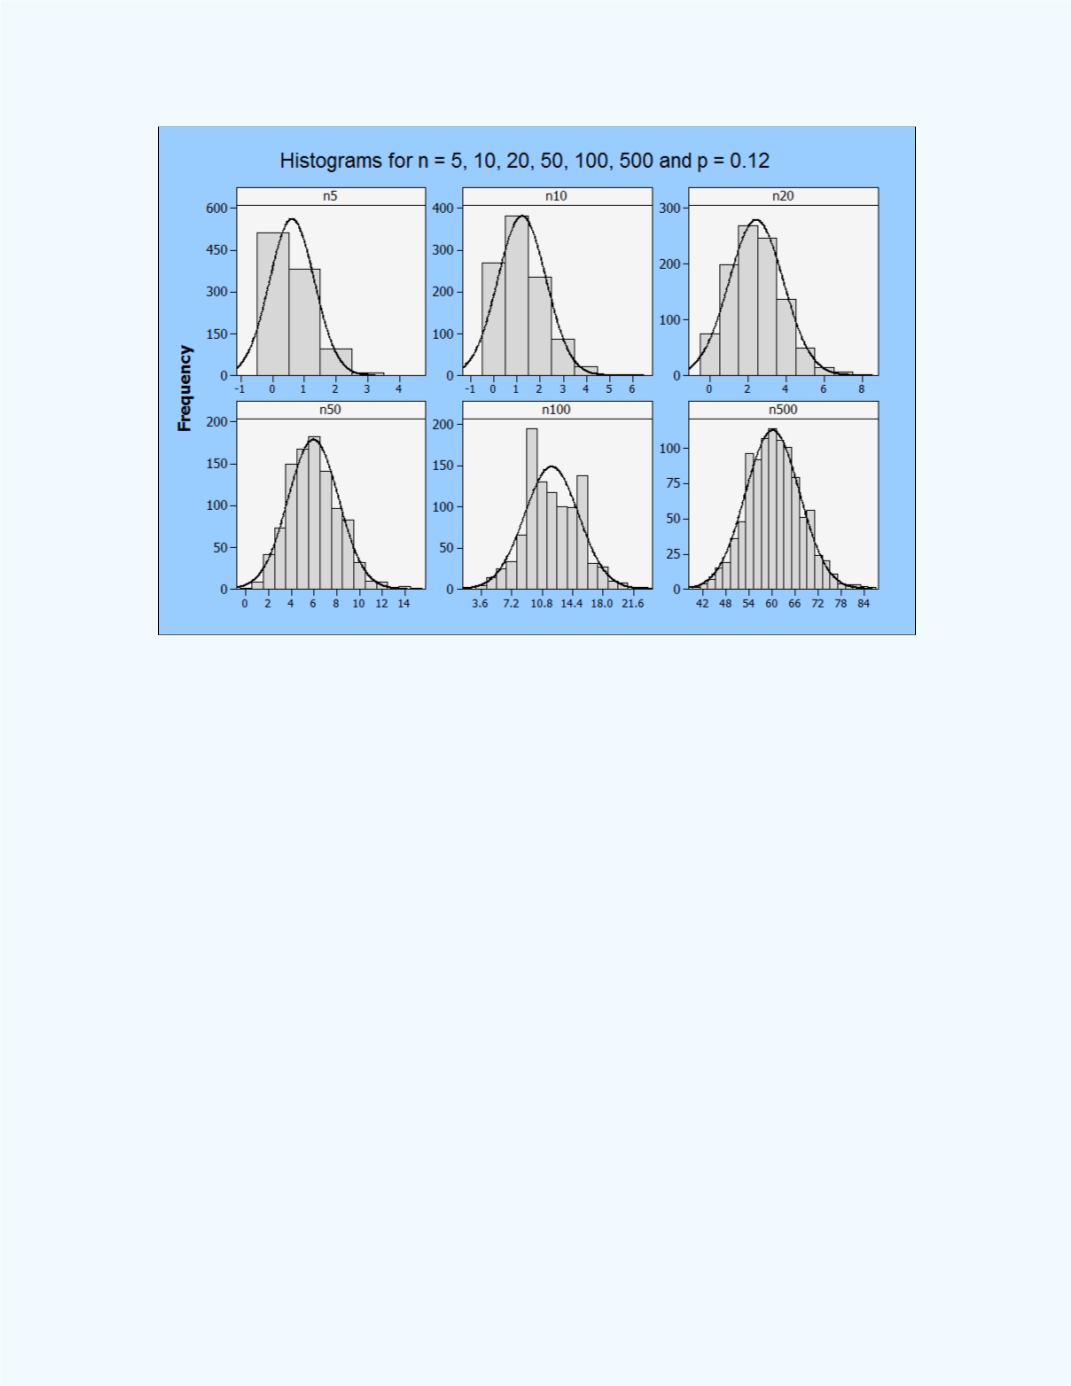
Figure 9-2:
The normal probability distribution approximation
as the limiting distribution for the binomial distribution
when
p
= 0.12
Note:
If you have access to statistical software you may simulate values for
a binomial random variable with different
and
values, and graph to
observe other patterns.
Figure 9-3
shows the histogram for 1,000 simulations from a binomial
distribution for
= 5, 10, 20, 50, 100 and 500, with
= 0.5. Observe that
the smooth curve that is used to approximate the distrubution is almost bell
shaped for any of the sample sizes when
= 0.5. Generally, this is true for
values close to 0.5.