


 366 / 762

366
Chapter 9: The Normal Probability Distribution
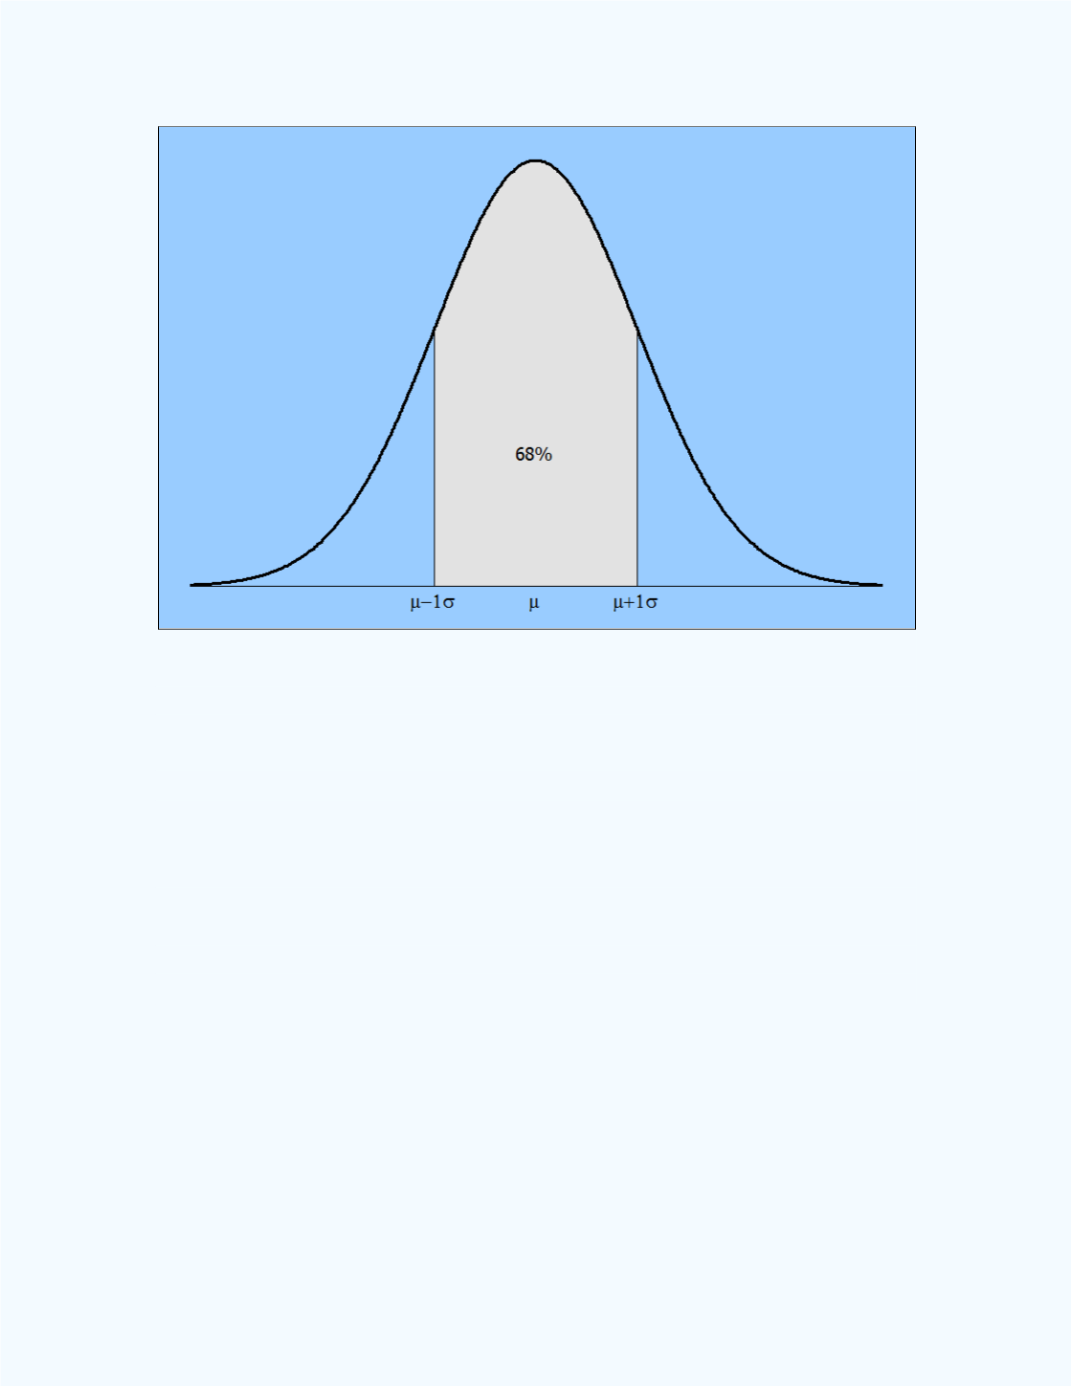
Figure 9-6:
Illustration of the one sigma rule
Illustration 1:
Recall the chest size data in the Introduction section of this
chapter. The distribution for this data set is displayed in
Figure 9-1
. In
Figure 9-7
the
red vertical lines
mark
- 1
= 39.832 – 2.05 = 37.78 and
+ 1
= 39.832 + 2.05 = 41.88. Observe that the chest size values to be
included in the computations ranges from 38 to 41based on which vertical
bars to be included from the histogram. The sum of the corresponding
relative frequencies is 0.130533 + 0.186999 + 0.188045 + 0.162774 =
0.668351
0.67. Refer to
Figure 9-8
for the computed probabilities. That
is, approximately 67% (close to 68%) of the values lie within one standard
deviation from the mean
.