


 371 / 762

Chapter 9: The Normal Probability Distribution
371
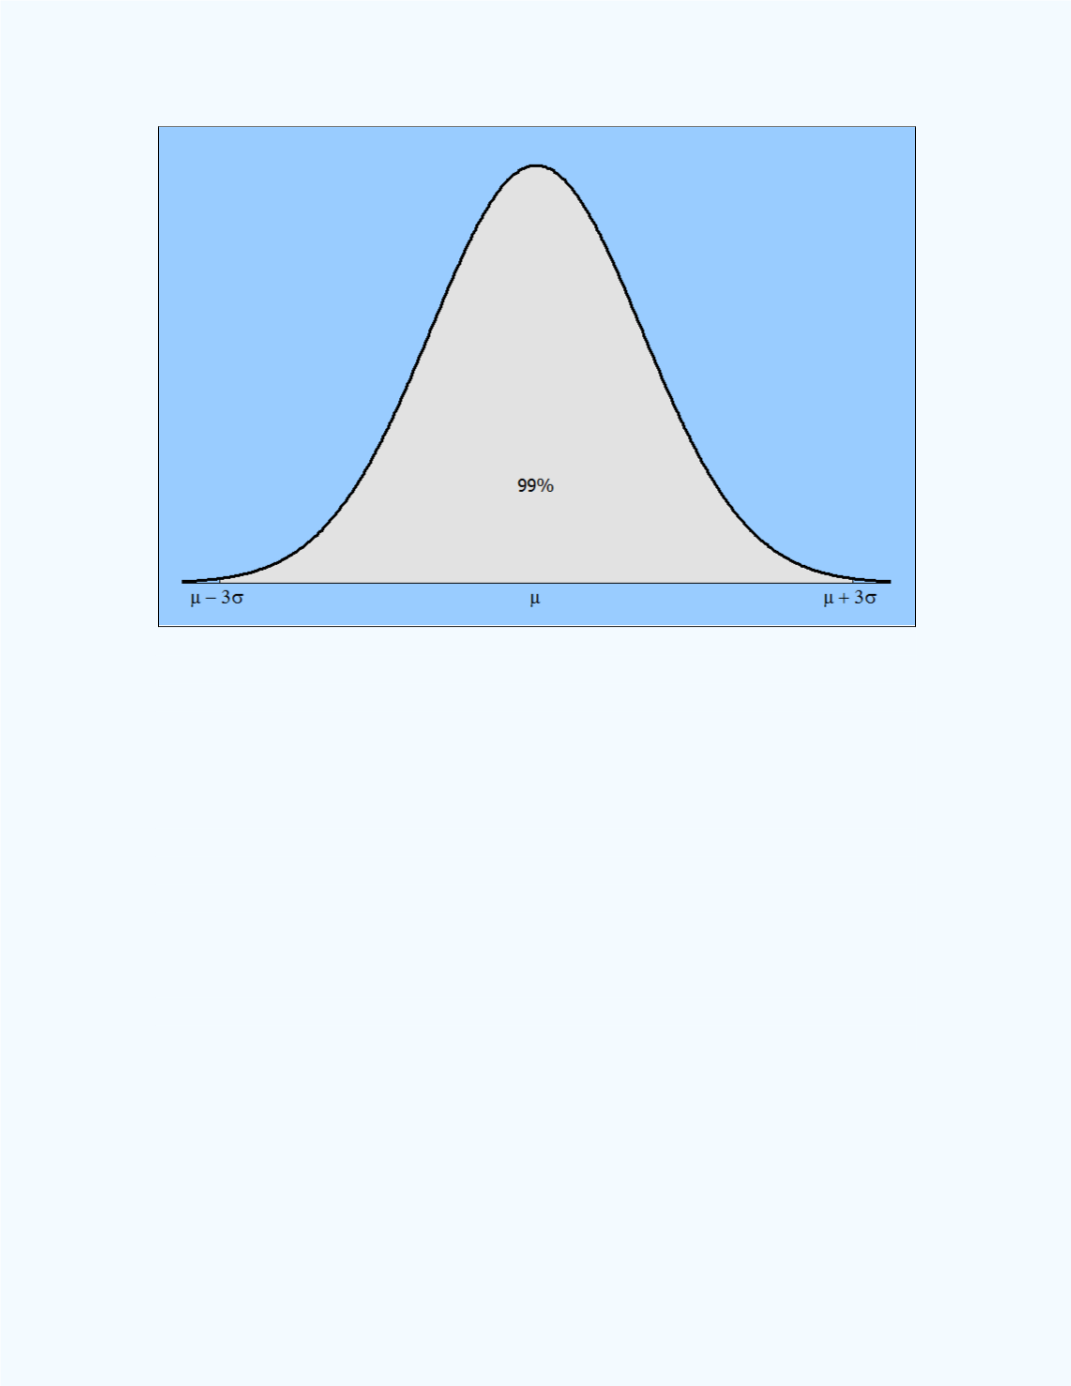
Figure 9-12:
Illustration of the three sigma rule
Illustration 3:
Recall the chest size data in the Introduction section of this
chapter. The distribution for this data set is displayed in
Figure 9-1
. In
Figure 9-13
the
red vertical lines
mark
- 3
= 39.832 – 3
2.05 = 33.682
and
+ 3
= 39.832 + 3
2.05 = 45.982. Observe that the chest size values
to be included in the computations ranges over almost the entire set of chest
size values. The range of values goes from 34 to 46. The sum of the
corresponding relative frequencies (probabilities) is approximately
0.998606. Refer to
Figure 9-14
for the computed probabilities. That is,
approximately 99.86% (close to 99.7%) of the values lie within three
standard deviations from the mean.