


 373 / 762

Chapter 9: The Normal Probability Distribution
373
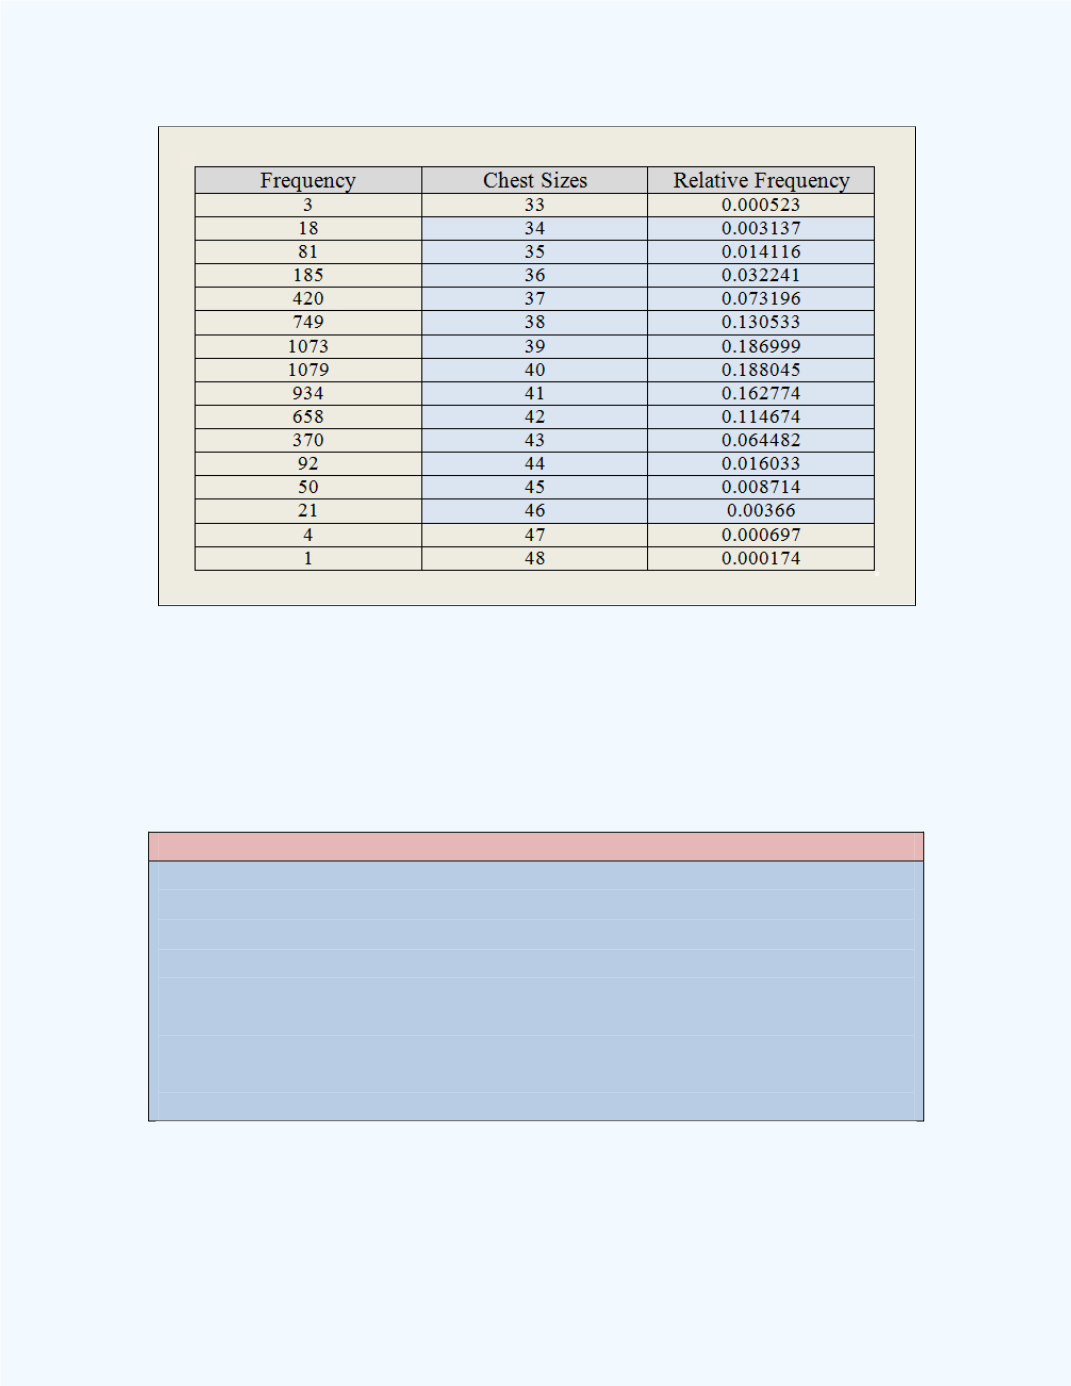
Figure 9-14:
Computed probabilities
to be included
for the Three-sigma rule for the Chest Size
data
Listed below in the
Notes
box are some properties of the normal distribition.
Figure 9-15
illustrates the third item in the box.
Notes:
The total area under the normal curve is equal to 1.
The probability that the normal random variable is equal to a given
discrete value is always zero, since the normal random variable is
continuous.
The probability that a normal random variable is between two values
is given by the area under the normal curve between the two given
values and the horizontal axis.