


 376 / 762

376
Chapter 9: The Normal Probability Distribution
-values, tables are limited to selected
-values used in the table. In addition
to the
-table, we can use appropriate technology to help with finding the
areas under the standard normal curve. Hand held technology (calculators)
such as the TI-83/84 etc. will aid in finding normal probabilities. In addition
to calculators, statistical software such as MINITAB, SPSS, Microsoft
EXCEL, etc. can also be used to find normal probabilities.
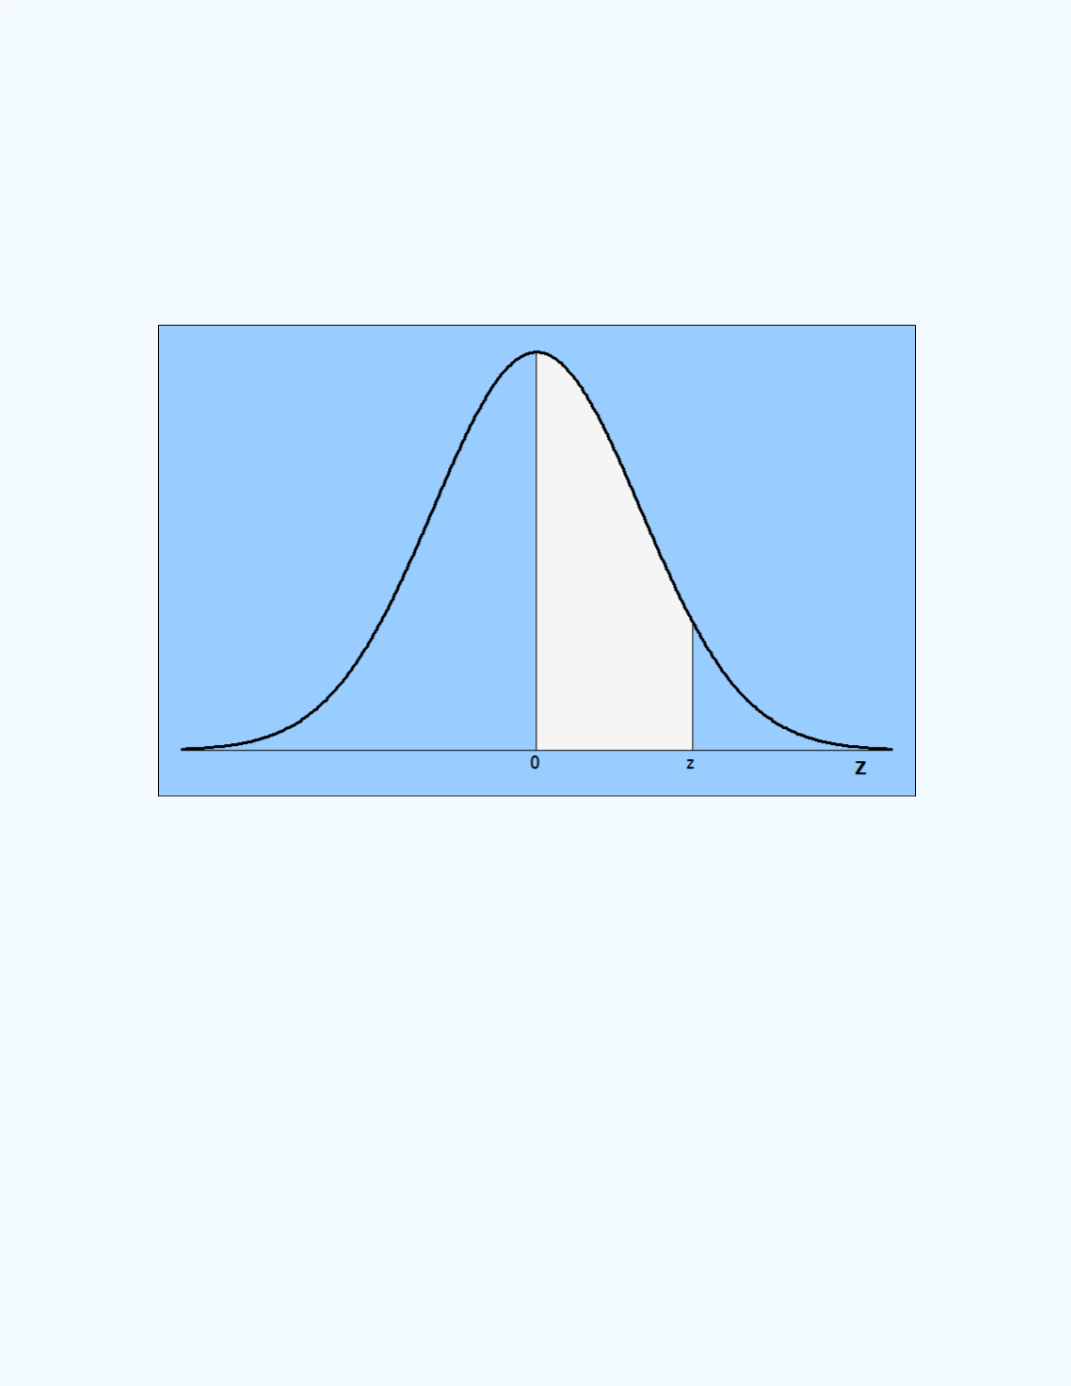
Figure 9-16:
Area under standard normal curve
between 0 and
z
A sample portion of a standard normal distribution table using four decimal
places is shown in
Table 9-1
.