


 377 / 762

Chapter 9: The Normal Probability Distribution
377
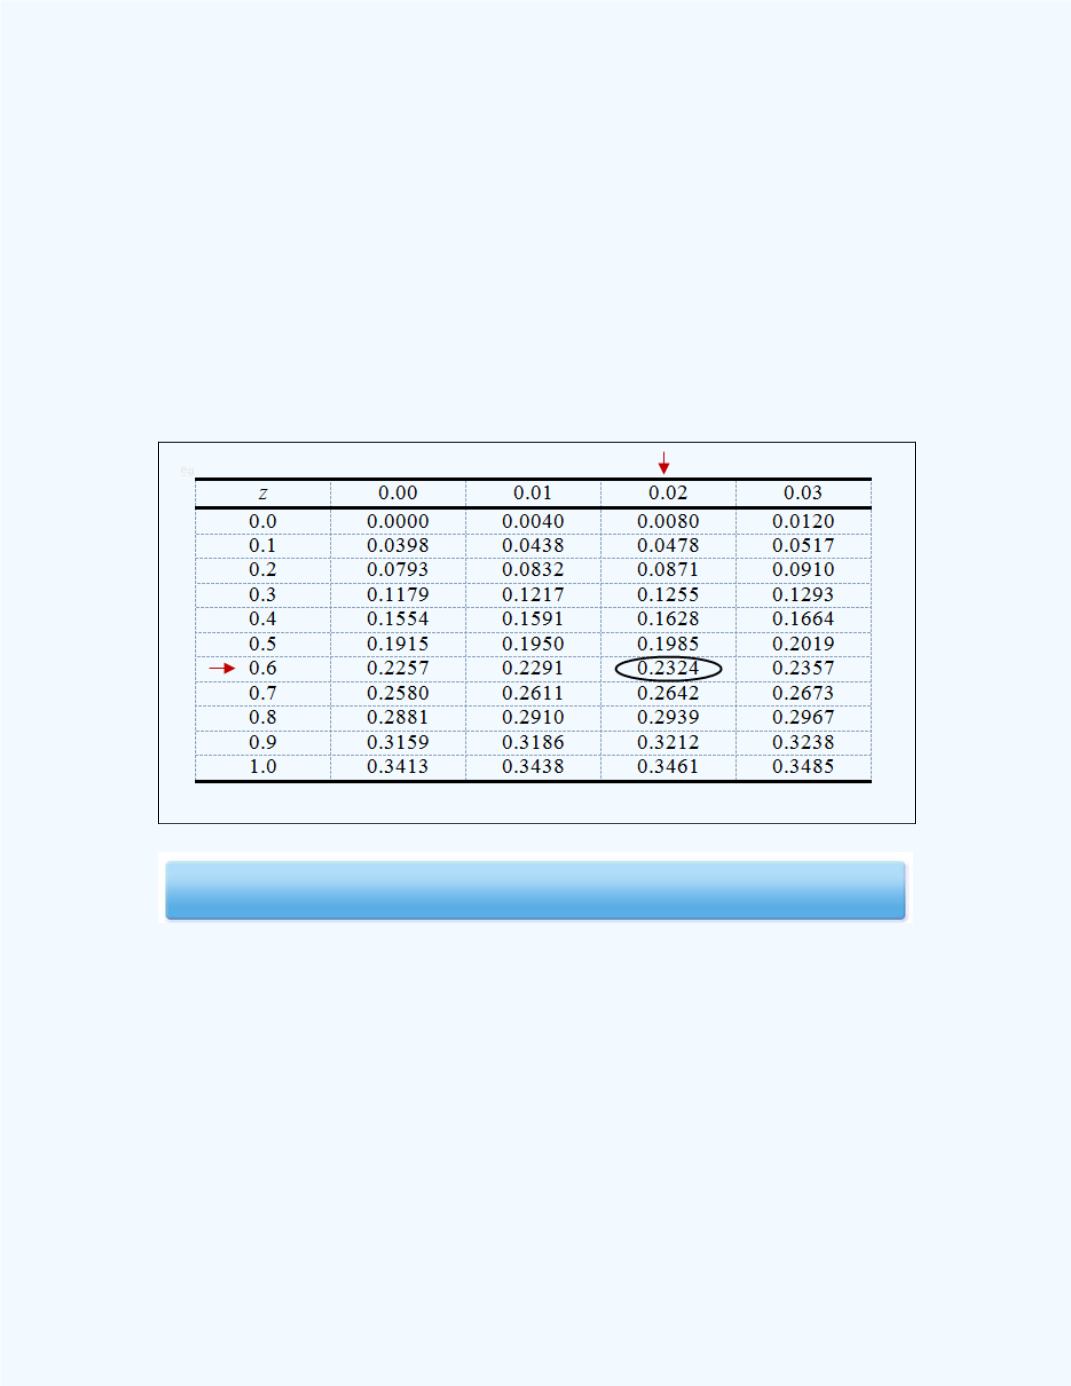
The first column in
Table 9-1
, gives the
-
values correct to one decimal
place, and the first row gives the second decimal place for a
score. For
example, if we wanted to find the area between
= 0 and
= 0.62, we will
find
= 0.6 in the first column, then look for
= 0.02 along the first row.
Where the corresponding row and column intersect gives the value of
0.2324. This is the area between
= 0 and
= 0.62. This is equivalent to
finding the probability that
will lie between 0 and 0.62. That is,
P
(0
0.62) = 0.2324 and the area are depicted in
Figure 9-17
.
Table 9-1:
Sample of the standard normal table
Click here for the z-Table Workbook