


 378 / 762

378
Chapter 9: The Normal Probability Distribution
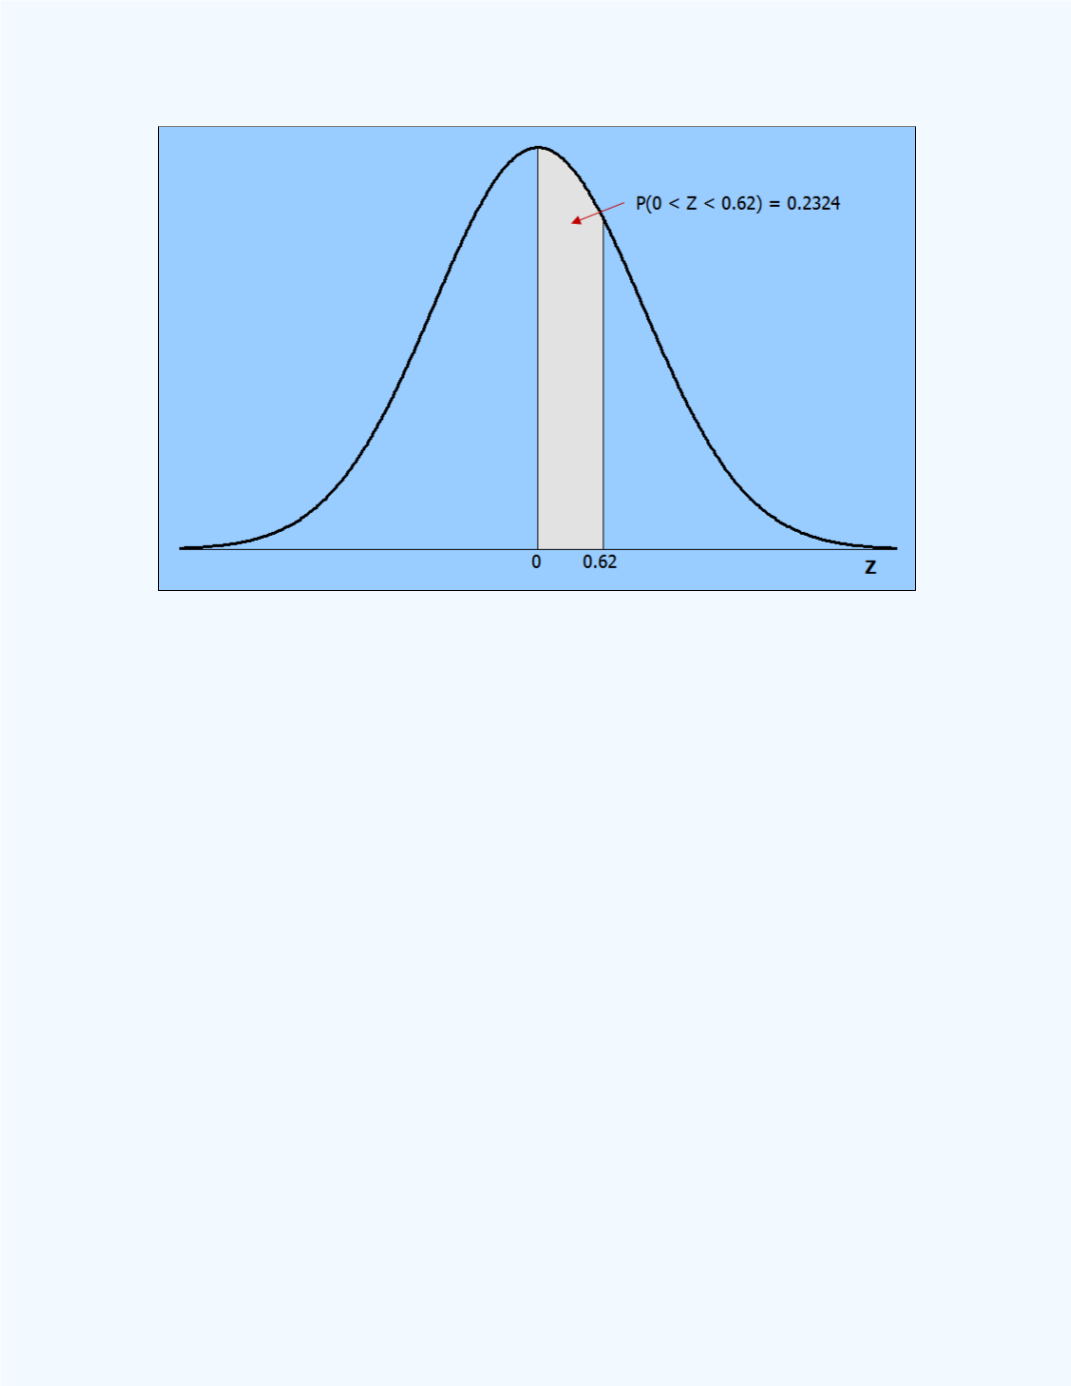
Figure 9-17:
Area representing
P
(0
z
0.62)
More extensive tables are available. These include areas to the left of a
given
-value (these are called cumulative probabilities) and areas to the
right of a given
-value. Again, these tables only include a limited number
of
-values.
Alternatively, we can use the
Normal Probability Distribution
workbook
to help solve the problem. This workbook can be used for any
-score value
and hence is much more useful than the limited tables. The solution using
the workbook is shown in
Figure 9-18.
Observe from the figure that the
mean is 0 and the standard deviation is 1. This means we are using the
standard normal distribution to find the required probability. Observe also
that since we are finding the normal probability between two numbers, 0 and
0.62, we will have to use the portion of the workbook with the two end point
values. Once the left end point of 0 and the right end point of 0.62 are
entered, the probability of 0.2324 will be computed and displayed. Note that
you will have to use a mean value of 0 and a standard deviation value of 1
since we are dealing with
-scores. Recall that the
z
-scores are normally
distributed with a mean of 0 and a standard deviation of 1.