


 379 / 762

Chapter 9: The Normal Probability Distribution
379
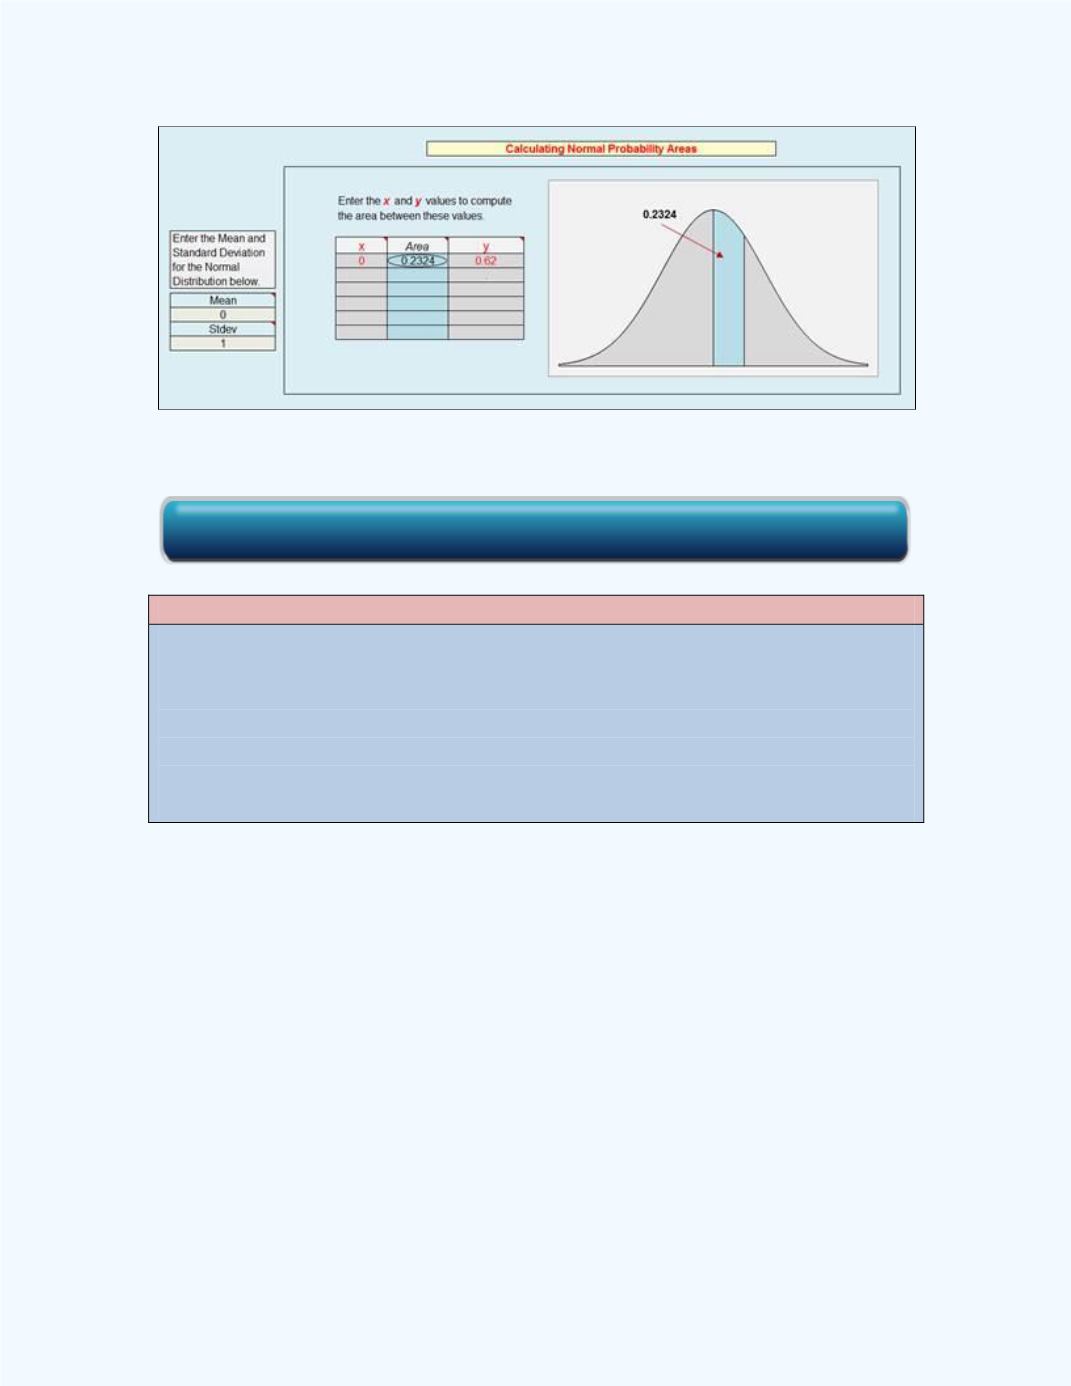
Figure 9-18:
Workbook output for
P
(0
z
0.62)
Note:
Although the e-book has the standard normal tables included in it, this table
will be used on a limited basis in the solutions of the problems relating to
normal distributions.
We will use the workbooks extensively to solve such problems.
Following are some examples relating to the standard normal distribution.
Example 9-1
:
Find the area under the standard normal curve between
= 0 and
= 1.9.
Solution:
This is equivalent to finding
P
(0
1.9). Using the
Normal
Probability Distribution
workbook to solve, we get
the value of 0.4713.
Thus,
P
(0
1.9) = 0.4713. The result is shown in
Figure 9-19
.
Click here for the Normal Probability Distribution Workbook