


 374 / 762

374
Chapter 9: The Normal Probability Distribution
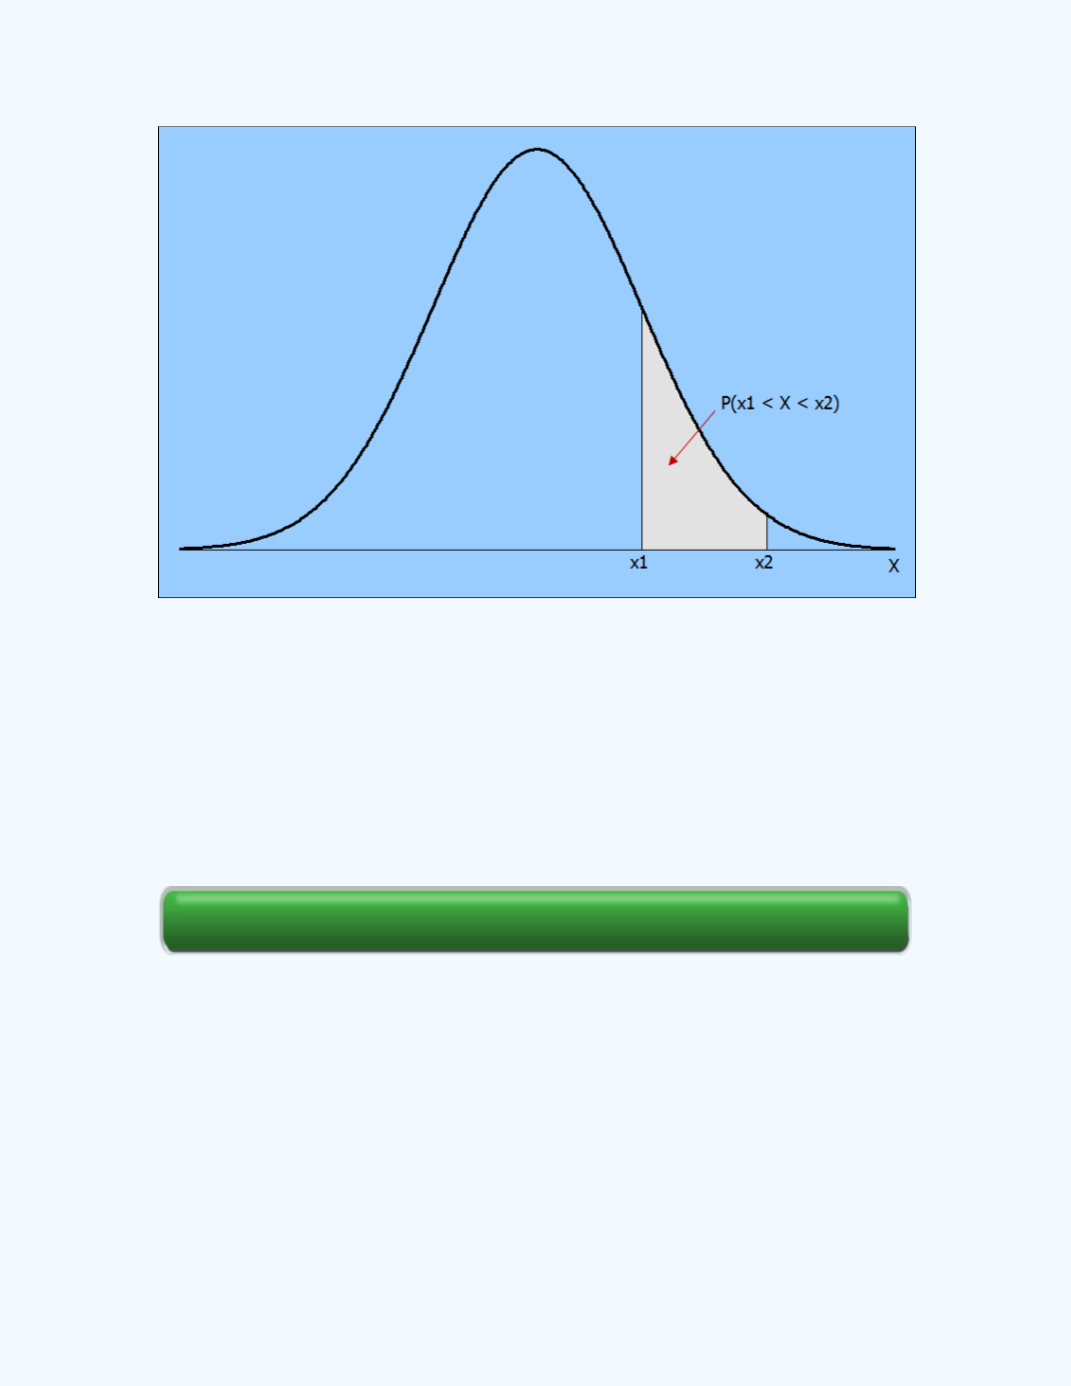
Figure 9-15:
Illustration for
P
(x1 < X < x2) under the Normal curve
Next we will introduce a special normal distribution called the standard
normal distribution.
Section Review
9 - 4 The Standard Normal Distribution
Since each normally distributed random variable has its own mean and
standard deviation, the shape and central location of the normal curves will
vary as illustrated in
Figure 9-5
. Thus, one would have to have information
on the areas under the normal curve for all of the normal distributions. This
of course will be impractical. Therefore, we will use information for a
e-Self Review